New Record Highs Coming?

2 comments

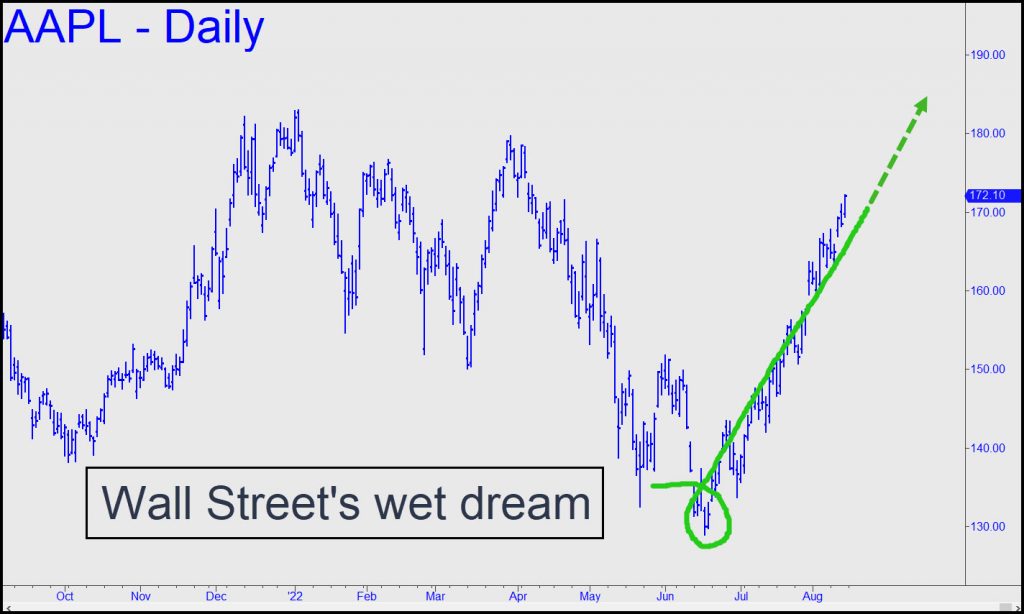
Is the stock market on its way to new record highs? The thought would have seemed preposterous just a week ago, when the Dow’s still-presumptive bear rally had yet to exceed even a single peak on the daily chart. But it did so last Wednesday, with a gap-up opening that demonstrated how spectacular daily gains can be engineered by Wall Street’s wizards to require little bullish enthusiasm or even much cash. As detailed here last week, this has been especially true of AAPL, the Titanic of the securities world and a crucial bellwether for investor sentiment. One might have thought it would take hundreds of billions of dollars to float the stock back to the surface following its nearly 30% plunge from a record $183 in January to a Mindanao low of $129 in mid-June. So many investors lost so much money as AAPL plummeted that their eagerness to recoup at least some of it should have turned the stock leaden the entire way up.

Suckers Never Learn

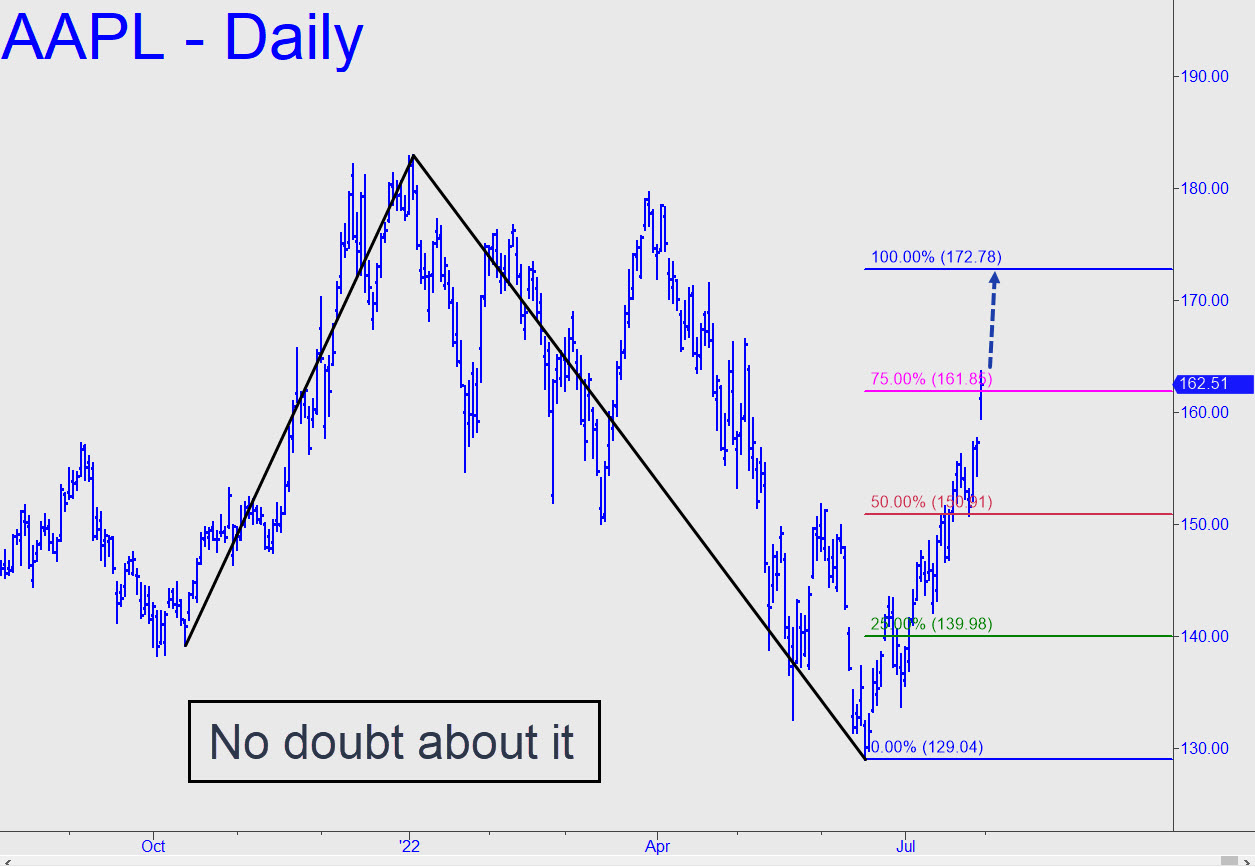
Instead, DaBoyz last week succeeded with little effort in driving AAPL to within a hair of a $172 target I’d disseminated to subscribers more than a month ago. Along the way, no fewer than a dozen times, they employed a trick that has never failed to work, even though the same suckers have been played countless times. The pros simply pulled their bids overnight, letting Apple shares fall sharply enough to dry up sellers. When bears realized at the opening bell that there was little or no supply to cover their shorts, panic buying into ghost offers did the rest. Thus did the resulting price spikes in the early moments of numerous sessions accomplish what merely bullish buying never could – i.e., goosing the stock past imposing peaks and thick layers of supply created by losers on the way down. We note that at Friday’s close, AAPL sat just 7% shy of new record highs, not even breathing hard.

In the meantime, its poor cousins, the once-mighty FAANG stocks, continue to languish near their bear-market lows. Will AAPL’s carny-booth handlers be able to vamp in the ozone for a couple of months until all the other stocks catch up?  This seems unlikely, and it will be interesting to see how they keep their all-time-favorite cash cow chill, since AAPL has been trained to behave on cue like a rabid badger. But how will the other stocks shake off a bear market and levitate to new all-time highs when Americans are mired in the worst crisis of confidence since the early 1970s? The answer is that their mood will improve as shares continue to rise, even if initially for no reason save short-covering.

Sardine-Like Prescience

As we watch the insanity unfold, assuming it does, let me suggest putting aside the widely believed but ridiculous notion that the stock market is able to see six months ahead and predict an economic upswing; for in demonstrable fact, the supposed prescience that drives these moves is non-existent. The market is no more prescient than a tin of sardines, and the collective wisdom often ascribed to it is actually just fear and greed operating at the sub-animal level of the id. Stocks rally for unfathomable cyclical reasons that have nothing to do with earnings or events in the real world. Ultimately, this could revive the epic delusion that the economy is getting ‘healthy’ again, even though it is supported by debt grotesquely larger than we will ever be able to pay down. Thus do bear rallies with no apparent basis in reality eventually win over the masses. As for the supposed ‘wall of worry’ that stocks climb when the headlines are depressing, the idea was popularized by a news media that cannot comprehend the obvious — i.e., that the stock market is a stupid, crazy beast, and that Fed funny-money has made it more insane than ever. But prescient?  Yeah, sure.

The foregoing explains why this permabear’s mind is open to the possibility that a fake rally could ultimately turn into a real one, even as the news headlines wax grimmer than ever. If you need a reason for new all-time highs, consider the prospect of the November election reversing America’s appalling slide into woke darkness, the strangling dictatorship of LGBTQQIP2SAA, and societal divisiveness verging on civil war. Will we be temporarily spared from deflationary ruin by a Republican blowout and a rip-roaring bull market? Among the nations of the world, America has always been luckiest. That is why we shouldn’t dismiss the possibility of a final, truly insane running of the bulls on Wall Street.
Rick's Picks for Friday
$ = Actionable Advice + = Open Position
Search touts by symbol

$MBTU22 – Sep Micro BItcoin (Last:21.25)

0 comments


Rick’s Picks Member-only content.You must be logged in to view this post

$+AAPL – Apple Computer (Last:174.15)

0 comments

What a shocker. The no-decision monkeys who have lived off AAPL’s autopilot bull market have succeeded in levitating the stock to within a split hair of the 172.78 target I spotlighted here weeks ago. It was trading in the 140s then, and it seemed difficult to believe at the time that the stock could rise that much on punk earnings, a U.S. economy sinking into recession, and Apple Inc. unable to innovate its way out of a Glad bag. But just look at it! Another 6% and it’ll be in record territory. I’ve documented the short-squeeze tactics that were used to goose the world’s biggest-cap stock skyward with hardly any bullish buying or even cash outlays. It was a simple trick: Let the stock drop overnight until sellers are exhausted, then run it up shorts’ wazoos on the opening bell. The rally has been a fraud every inch of the way, but there’s no denying it worked. And now what? Can AAPL wait for the broad averages to catch up? Probably not, since the Nasdaq and even the FAANGs are trading closer to their bombed out lows than to their insane, all-time highs. It should be interesting to watch the DaBoyz try to vamp for a month or two while the U.S. economy continues to sink into the crapper. Stay tuned to this page and the chat room for the technical play-by-play. _____ UPDATE (Aug 15, 7:43 p.m. EDT): A feebler than usual short squeeze topped at 173.40, 0.3% above my target, so I recommended buying the expiring 165/160 put spread 16 times for 0.12. This is a 30-to-1 horse, so don’t get your hopes too high. Offer eight of them to close for 0.25, good through Wednesday and contingent on the stock trading 170.00 or higher. _______ UPDATE (Aug 17, 10:36 p.m.): Our horse is now a 90-to-1 shot, but I hope the $200 you blew on it saved you $$ thousands because you were less tempted to short the E-mini S&P futures instead. _______ UPDATE (Aug 18, 8:52 p.m.): DaBoyz were either inidiiferent or too lazy to try their usual short-squeeze shenanigans today, so the stock’s performance must be viewed as an honest reflection of underlying supply/demand. Since it performed poorly with an ‘inside day’ relative to the previous day’s elongated price bar, we should expect the stock to start roll down as the week ends, presumably setting a bearish tone for Sunday evening. We’ll book a $200 loss on the spread nonetheless.

$ESU22 – Sep E-Mini S&P (Last:4281.25)

0 comments


Rick’s Picks Member-only content.You must be logged in to view this post

$CLU22 – September Crude (Last:90.73)

0 comments

Crude would trigger a ‘mechanical’ short if it touches the green line x=96.15. However, because the impulse leg was such an agonizing slog, I can recommend this trade only to subscribers who know how to cut the implied theoretical entry risk of $23,000 on four contracts to perhaps a tenth of that. It would require close attention to ‘camouflage’ opportunities on the sub-15-minute charts, aka ‘camouflage. Merely spectating will have its rewards, since the next leg down should help snuff inflation at the pump as well as the unchecked greed of Big Oil. _______ UPDATE (Aug 15, 7:54 p.m.):  Use the 81.79 target shown here as a minimum downside projection for the near term. If this Hidden Pivot support fails, the next step down would be to 78.93, calculated using A=111.14 from June 29.  _______ UPDATE (Aug 18, 9:27): The failure of bears to reach p2=84.66 of the pattern shown in the thumbnail inset suggests it is on its way up to at least to the green line (x=96.11). It would trigger a ‘mechanical;’ short there, stop 101.85, but I am not recommending the trade because of the weakly erratic nature of the A-B impulse leg.

GCZ22 – December Gold (Last:1778.70)

0 comments

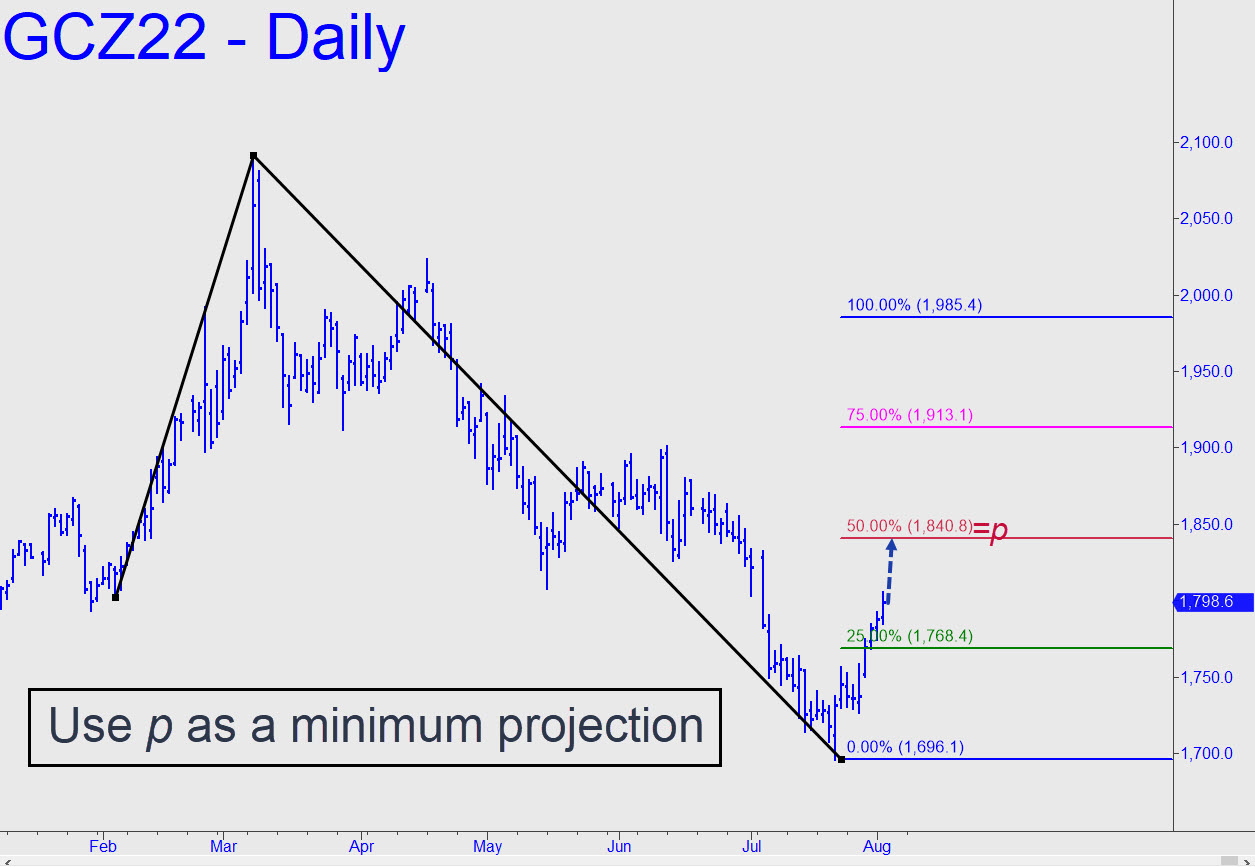
Gold has been huffing and puffing for two weeks without making much headway. That’s not saying it can’t still pop through p=1840.80 with brio, but we’ll need to see it happen before we get excited. Thereupon, p2=1913.10 would become out minimum upside objective, with a shot at 1985.40 for the bull cycle begun three weeks ago from 1696. As always, a decisive penetration of any of the three Hidden Pivot levels implies a continuation of the trend to the next. The pattern looks likely to produce winning ‘mechanical’ buys if gold hits an air pocket as it seems wont to do whenever bulls get too interested. _______ UPDATE (Aug 17, 11:06 p.m.): Maybe the D=1772.2 downside target shown in this chart will provide a respite for buils, however brief and unsatisfying? ______ UPDATE (Aug 18, 9:32 p.m.): It provide no respite whatsoever when the ‘hidden’ support gave way like wet tissue. But none of us could have been surprised, since gold, in its tedious bottoming process, seems to delight in disappointing bulls about 90% of the time. This may be an even more dismal spell than usual, given the dollar’s bullish breakout (see my DXY update elsewhere  on this page.  

SIZ22 – December Silver (Last:20.84)

0 comments

December Silver appears on track for  push to the 21.93 ‘D’ target of the pattern shown. The odds were somewhat enhanced when last week’s dip from just above the red line (p=20.78) failed to provide a ‘mechanical’ buying opportunity by reaching the green line as required. Don’t pass up a buying opportunity if it should swoon to x this week, but check the chat room for risk avoidance guidance before you leap. The rally target lies within a thicket of supply deposited on the daily chart last spring, and so a decisive push through D would be more impressive than usual. ______ UPDATE (Aug 17, 11:19 p.m.): My mild enthusiasm for Silver appears to have been  unwarranted, perhaps because I overqualified the impulse leg that seemed to be driving the rally. The last piece of it exceeded no ‘external’ peaks, even though the launch stage got past some small ones near the bottom of the move. Anyway, the December contract appear likely to abort the 21.95 rally target, and I’m not about to sugarcoat what could happen after that.  The disappointing picture is shown in this chart.

$+TLT – Lehman Bond ETF (Last:115.96)

0 comments

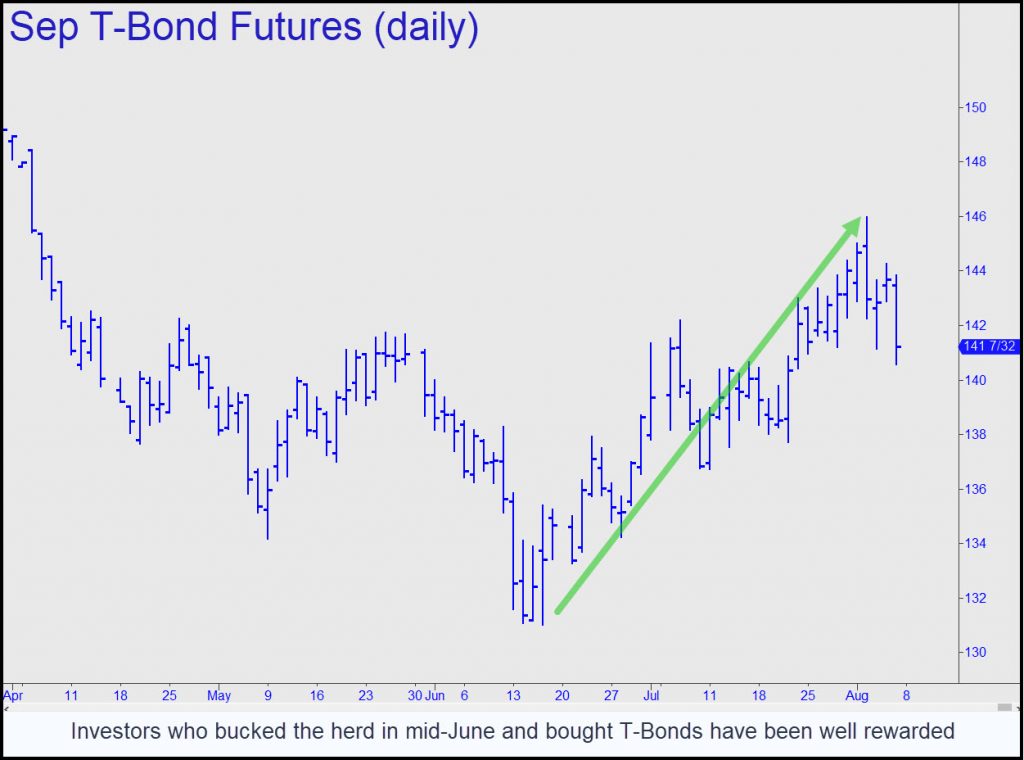
Last week’s steep fall to the green line from just shy of D will provide an interesting test of ‘mechanical’ set-ups, since they are designed to signal buying opportunities when one’s instincts shout ‘Flee for your life!’ Bulls must have been feeling like that on Thursday, when the downdraft reached a perhaps temporary bottom. It should be good enough to propel TLT to at least p=116.90, but I hadn’t recommended buying at x unless you are familiar with ‘camouflage’ set-ups that can pare entry risk by as much as 95%. Please let me know in the chat room if you took the trade and I’ll establish a tracking position if there are at least two of you. ______ UPDATE (Aug 15, 11:05 a.m. ET): The gap-up opening hit 116.75, so you should be out of half the position. I’ll use the current price of 116.17, well off the high, to establish a cost basis of 112.91 for the 200 shares that remain. Tie them to an impulsive stop-loss at 114.83 for now, o-c-o with an offer of 100 shares at 118.50 and another 100 at 119.30. _____ UPDATE (Aug 16, 5:27 p.m.): For those who actually did the trade, the stop would have taken you out today for a $384 gain. We got lucky, since this vehicle has been trading like garbage.

$DXY – NYBOT Dollar Index (Last:107.63)

0 comments

Groping for a bottom, the Dollar Index has already triggered one false ‘buy’ signal this month. A new signal would be generated by a 106.06 print, but we’ll need to monitor the lesser charts if and when it gets there to determine whether the rally is for real. If so, that would imply minimum upside thereafter to at least 107.46, the midpoint Hidden Pivot resistance of the pattern shown. If the trend pushes easily past it, we could be looking at new highs by mid- to late September. _______ UPDATE (Aug 15, 8:00 p.m.): The decisive pop through 106.06 implies the rally is bound for a minimum p2=107.46.  _______ UPDATE (Aug 18, 9:41 p.m.): And now today’s pop through p=107.46 strongly implies that p2=108.87 will be reached. That will of course set up a test of July 14’s importnnt peak at 109.29. Keep D=110.27 in mind if and when p2 gives way.

$GDXJ – Junior Gold Miner ETF (Last:33.67)

0 comments


Rick’s Picks Member-only content.You must be logged in to view this post

Thoughts on ‘The Drive’

[The following went out last month to clients of my friend Doug Behnfield, a wealth management advisor and senior vice president at Morgan Stanley in Boulder CO.  Like your editor, he is skeptical that consumer inflation can persist for long with the U.S. economy in recession and a bear market in progress. Deflation is coming, he says, along with a further decline in stocks of at least 20% from early July’s lows. Doug has been recommending long-dated Treasurys both as a defensive investment and for potential long-term capital gains from falling interest rates. RA] 

On January 11, 1987, the Denver Broncos played their last playoff game of the season at the Cleveland Browns. It was rainy and muddy. With 5 minutes left to play, the Broncos had the ball on the two-yard line after a muffed kickoff return and the score was 13-20, Cleveland. Legend has it that as the huddle was called on the two, ProBowler and offensive lineman Keith Bishop said to the team; “We got ‘em right where we want ‘em!” Through a series of runs and passes, sacks and scrambles, John Elway led his team 98 yards to score a touch-down to tie the game. The Denver Broncos won in overtime and went on to the championship game.

The first half of 2022 is characterized by a bear market in stocks with the S&P 500 down 20.58% and the NASDAQ down 29.51%. While shorter maturity bonds were down much less, the longest duration Treasury and municipal bonds were just as bad as stocks. The Index of long Treasury Strips was down 27.90%1 and the CEF Connect Index of National Leveraged closed-end Municipal Bond Funds was down 20.1%2 . Here, at the end of the first half of 2022, we are staring at the worst start to a year for stocks and bonds in decades. We got ‘em right where we want ’em.

Supply Shocks Could Fade

The combination of a loss of upward price momentum and very disappointing economic data are the primary causes of the stock market decline. Unexpected CPI inflation and a powerful pivot toward rate hikes by the Fed are the primary cause of the rising bond rates and resulting price drops, but the prospect of Fed hikes and rising interest rates across the yield curve hurt stocks too. Under normal circumstances, recessionary economic conditions and a bear market do not coincide with growing inflation for very long. The oil price shock in 2008 ended halfway through the Great Recession and in the process, CPI inflation reversed from 5.6% in July of 2008 to -2.1% (deflation) in July of 2009 . In this case, the increase in inflation has not only been long, but steep and broad as well. Because the current price increases have occurred globally and are almost entirely attributable to supply shocks, they could fade quickly. The Fed’s hawkishness has already had a severe negative impact on demand for housing, autos and discretionary consumer goods in general. David Rosenberg characterized the current environment and likelihood of a recession this year as follows:

“This is as close to a slam dunk call as there is — and the fact that the Fed is pushing back hard, in fact, with a 4%+ real GDP growth view for the second half of the year, is actually pretty scary. Then again, going back to every recession since 1970, not once did the Fed economics staff see a recession — even when the downturn began the very next month. The spending intentions numbers were simply horrible in the UMich report. Auto-buying plans dropped to an all-time low, and for homes, plans are the weakest they have been since July 1982. The overall “buying conditions” index sank to its lowest level ever — the “good time to buy” a big-ticket durable is down to the November 1952 reading.”

From Inflation to Recession

There is plenty of evidence that the narrative on Wall Street is changing from Inflation to Recession. Along with it, supply bottlenecks are easing and the price of commodities such as metals, grains, lumber, oil and natural gas appear to be rolling over. Higher mortgage rates and record high home prices have ground the housing market to a halt, just as over a million rental units are scheduled for completion in the next months. If weakness in the economy (that appears to be leading to recession) should continue, the result may be similar to 2008-2009, i.e., deflation and lower interest rates. In the meantime, because of very disappointing consumer spending data, the Atlanta Fed, who had just reduced their estimate of the just-completed second quarter from 0.3% to -1.0% on June 30, has sliced it to -2.1% on July 15 . This is a very steep, negative trajectory for the economy.

Mike Wilson, Morgan Stanley’s Chief Investment Officer, is anticipating that we will be in recession as the year draws to a close and if so, the stock market is vulnerable to at least an additional 20% stock market decline from current levels. He also states that, under these circumstances, long-duration Treasury bonds should be added to portfolios, even as equity exposure should become much more defensive. He has been remarkably prescient, particularly since the markets started becoming much more difficult last fall.

As in most cases, Bob Farrell’s observation that “It’s the market that makes the news, not the news that makes the market”, applies to our current environment. We have seen continuing deterioration in stock prices and the counter-trend rallies are becoming less significant. On the other hand, it appears that a meaningful trend change has occurred in bond yields and prices. Note that the solid line in the following charts is the 50-day moving average. It is widely followed in technical analysis as an intermediate trend indicator. The 50-day moving average for bond yields had been up since Christmas but has recently reversed down in somewhat dramatic fashion. The S&P 500 is firmly entrenched in its downtrend that began at the beginning of the year.

Lowering Fed Expectations

Needless to say, unlike football, investing is not a game. The first half of 2022 has been brutal for the performance of both stocks and long-term bonds. It really does appear that the tide has turned and the risk of recession is beginning to dominate the narrative in the investment community, even as the weight of the evidence is less supportive of continuing high inflation readings. Commensurate with the weak economic data that has been seeping in and the bond market rally since mid-June, expectations for further Fed rate hikes have been pared back substantially. Even as Fed hike expectations have been coming down, expectations for cuts have moved up on the calendar.

This change in Fed expectations from 4.0% down to 3.25% (.75% decline) on the Fed Funds rate has been accompanied by a .70% decline in the 10-year  Treasury bond yield and .46% decline in the 30 year Treasury bond yield. At this point in time, the weight of the evidence (while still a bit muddy) points to lower interest rates and a continuing rally in long-duration bond prices.

GCZ22 – December Gold (Last:1802.80)

The picture shown makes much better visual sense than the tortuous, gutless pattern I posted here earlier. (It had an erroneous target to begin with.) The new graph will enable us to use p=1840.80 as a minimum upside projection, and D=1985.40 as a best-case objective for the next 6-8 weeks. Depending on how the uptrend interacts with p=1840.80, I may move ‘A’ down to the marquee low at 1793.50 to produce a slightly higher target. There are no guarantees that the rally will achieve 1840.8, since the chart lacks sufficient information as yet to determine this.  At a gut level, though, it looks safe to use 1840.8 as a minimum upside projection.

DXY – NYBOT Dollar Index (Last:105.83)

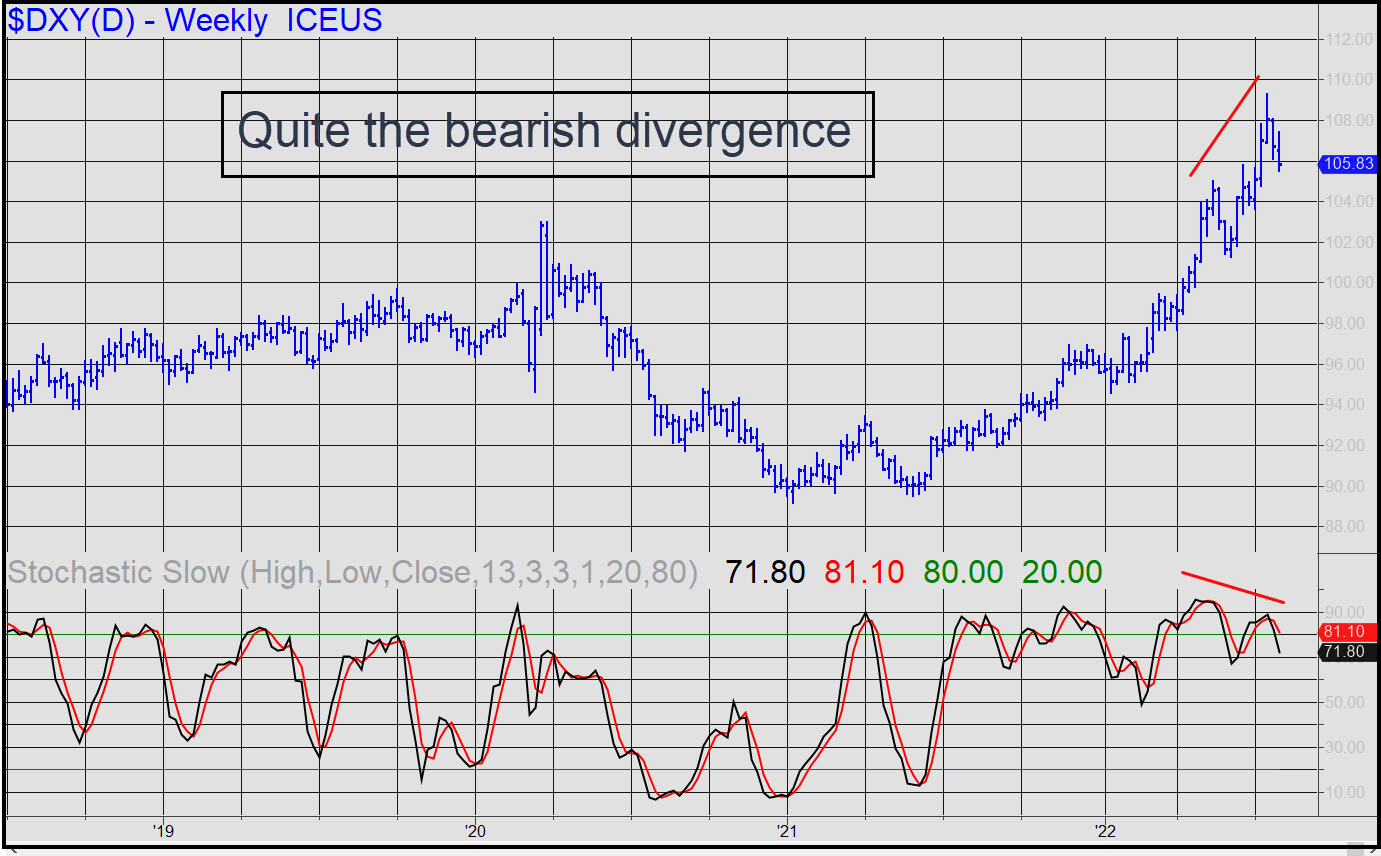
This correction could turn out to be be the most significant since the Covid outbreak in 2020. Higher peaks this spring diverged from lower stochastic peaks, as you can see. This is quite bearish and portends more weakness until the stochastic lines reach the oversold zone between zero and 20. There are no obvious Hidden Pivots target below, but an imaginative reading of the weekly chart suggests the dollar could grope its way down to as low as 97.63 in search of  bottom. That would represent an ostensibly healthy, 10% correction from the 109.29 high recorded a few weeks ago. It would probably be misread as the dollar’s death knell, but from a technical standpoint the retracement could prepare the buck for a rally strong enough to usher in an era of deflation that seems inevitable.

AAPL – Apple Computer (Last:168.50)

Whatta guy! Nothing has happened to brighten the picture for Apple, but that hasn’t stopped it from reversing out of a bear market abyss with such force that you’d think Covid-induced nuttiness was rampaging again. You’ve got to hand it to the institutional chimpanzees who have never sold a single share of the stock since Steve Jobs resurrected the company. They’ve shown unflagging confidence and limitless patience since the Great Financial Crash of 2007-08, waiting this time for the perfect opportunity to trigger off a short squeeze menacing enough to turn bears into panic-stricken buyers. Realize that this is the biggest-cap stock in the world, and that every inch of the rally would ordinarily require trainloads of money, were it propelled by merely bullish buying.  Shorts have done all the lifting, though, into supply lightened by greed; by large, airy gaps in supply at odd hours of the night; and by the misplaced confidence of widows, pensioners and hayseeds enticed by the last stock-split.  From a technical standpoint, the 172.78 target shown makes a logical and compelling upside target. It should be shorted aggressively, especially if you’ve made money on the way up. This Hidden Pivot is close enough to January’s record high at 182.63 that its attainment would most surely get investors salivating over the prospect of another monster leg up for a bull market now in its 161st month. ______ UPDATE Aug 10, 8:15 p.m.): This short in AAPL is for entertainment only, since it already triggered at 168.93. It is similar to the trade I’ve suggested in ES, except that the price where I’d have anchored the ‘C’ high has already been exceeded. That makes it riskier than if we’d acted during the regular session.  Theoretical entry risk is only about 40 cents per share nonetheless, with half to be covered at p=168.54 and the remainder held for a home run. ______ UPDATE (Aug 11, 5:20 p.m.): The strictly-for-fun short was a non-starter even though the scumballs who work AAPL for a living began the day with a bull-trap squeeze. What a stretch. I’ll be curious myself to see how they jack the stock to my 172.78 target, since maintaining high relative strength in a falling market takes lots of muscle.

ESU22 – Sep E-Mini S&P (Last:4164.25)

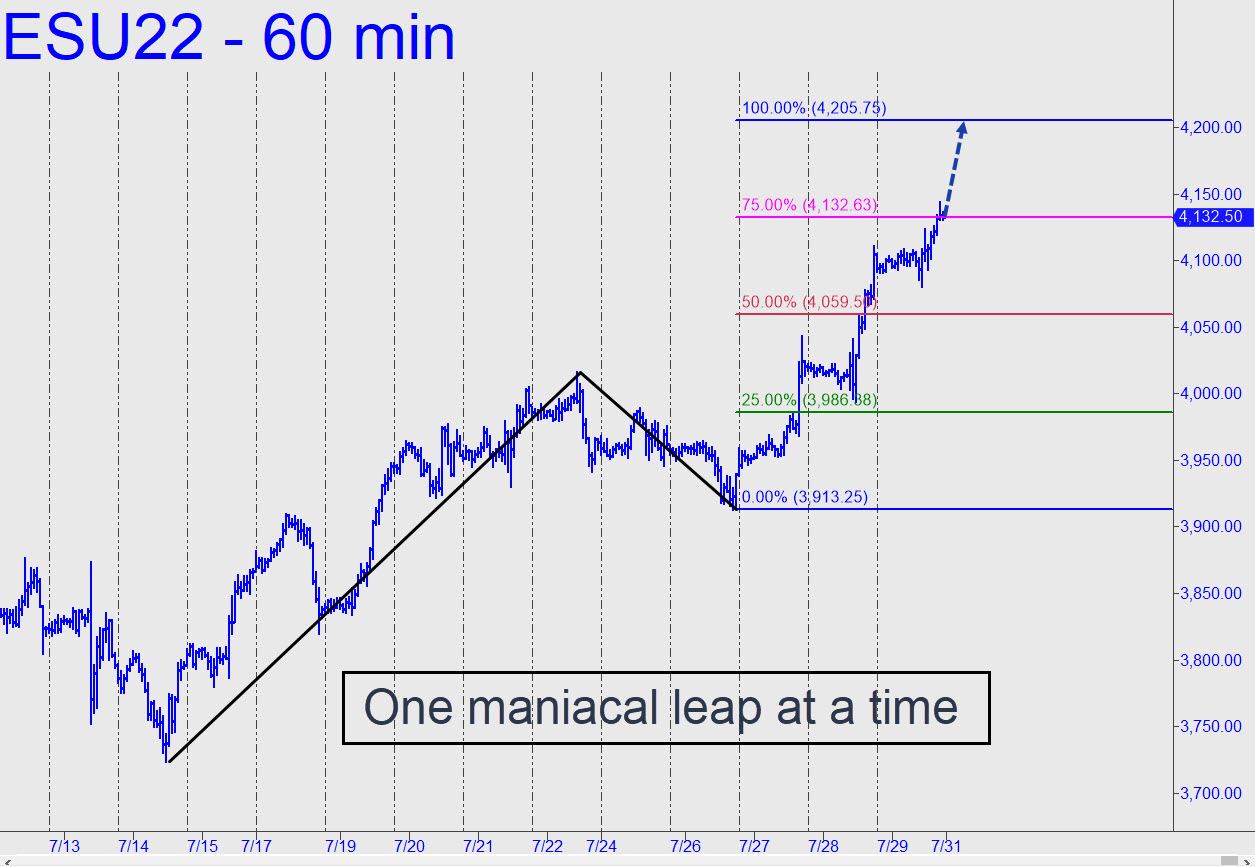
The futures shredded their way past a 4116 ‘hidden’ resistance with such ease that the remaining target at 4256 now seems likely to be achieved. Please note that this is not a Hidden Pivot, but rather an instinctual spot to anchor the ‘c’ high of a ‘reverse’ pattern in order to get short. I’ll calculate the a-b interval if and when we get there, but my gut feeling is that it will be about 25-30 points, yielding implied initial risk of about $300-$350 per contract. In the meantime, you can use the middling pattern shown to project a tradeable target at 4205.75. There have been no pullbacks so far that would have enabled a ‘mechanical’ buy on the hourly chart, but D=4205.75 will be shortable nonetheless, presumably using a ‘camo’ set-up. You can be more aggressive, shorting the target with a tight stop, if you’ve made money on the way up. _______ UPDATE (Aug 4, 10:45 p.m.): A freaky Friday swoon to x=4118.69 would trigger an appealing ‘mechanical’ buy, but I am recommending the trade only to subscribers who can cut the $8000 risk on four contracts down to something more comfortable.  Please note that ‘x’ is neither a support nor a target.

GCZ22 – December Gold (Last:1782.70)

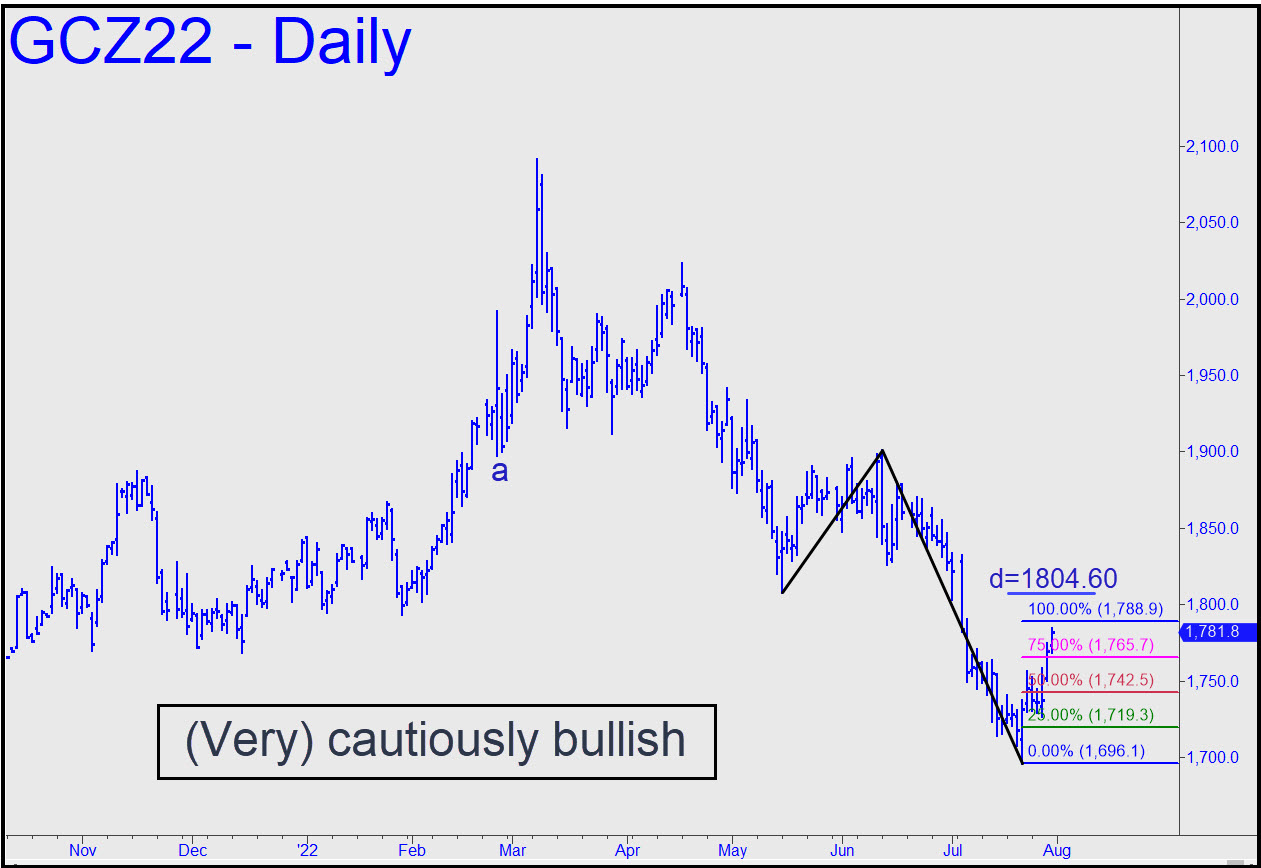
I said I’d loosen up on gold if the December contract popped through three ‘external’ peaks,  the highest of which lies at 1785.80. It very nearly succeeded, falling just 1.30 shy of my benchmark when the clock ran out on buyers Friday. However, I remain distrustful of gold’s rallies nonetheless and probably would not have become less skeptical even if this rally had met my bullish criterion.  Beginning with the July 21 bottom, it has been a shaky, ratcheting affair all the way up. The fact that it couldn’t muster the extra inch it would have taken to surpass the small-ish peak at 1785.50 has left my mild skepticism intact. Accordingly, I’ve used two modest patterns to project unambitious targets. The first lies at 1788.90, just $6 above, and comes from a reverse pattern begun with a low near 1800 in early May. The second, at 1804.60, is derived from a larger rABC tracing back to a point ‘a’ low made in February. I’ll be watching closely to see how much resistance they put up, but either can be shorted using ‘camouflage’, especially if you’ve been long on the way up.

SIU22 – Sep Silver (Last:20.03)

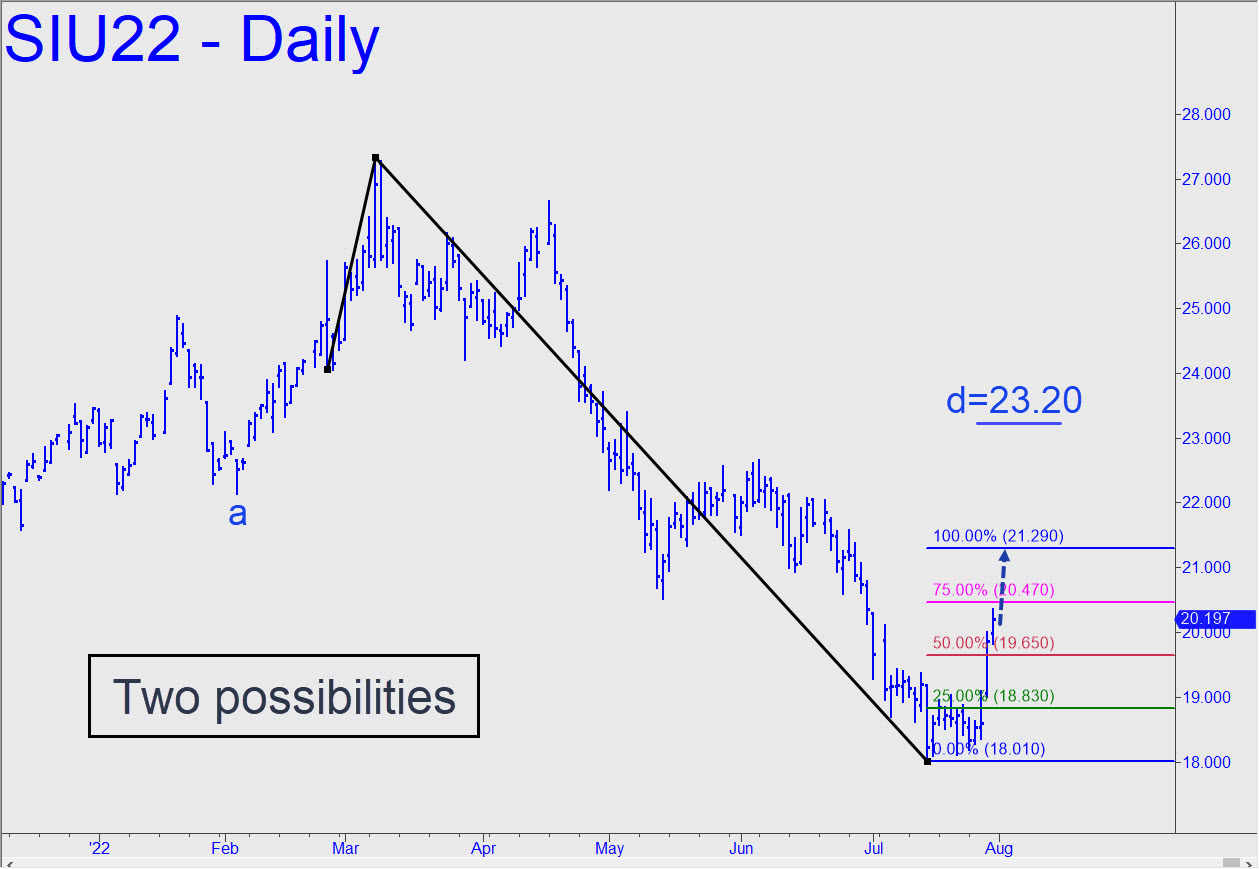
Silver’s rally has come from a promising place, a hair beneath a ‘secondary’ Hidden Pivot at 18.06. This has provided the kind of high-octane boost we’ve come to associate with reversals at p2. I’ve used a modest rABC pattern nonetheless to project a 21.29 target somewhat more challenging than the one at 1788.90 in December Gold. The target looks all but certain to be achieved, given the fist-pump past p=19.66 last Thursday. The pattern can be used to get long ‘mechanically’, most obviously via a swoon to the green line (18.84). If 21.32 is eventually exceeded, especially decisively on first contact, I’d raise my sights to  23.20, a ‘D’ target derived from the  large reverse pattern begun from 22.14 (labeled ‘a’ in the chart). Please note there is a midpoint resistance at 20.60 associated with that last target, and a precise pullback from it would validate the pattern itself if not necessarily ensure that 23.20 will be achieved. _______ UPDATE (Aug 3, 4:25): The rally missed 20.60 by 9 cents — not quite close enough to validate the pattern and target, nor to set up a high-confidence ‘mechanical’ buy if the relapse hits x=19.30.

GDXJ – Junior Gold Miner ETF (Last:33.48)

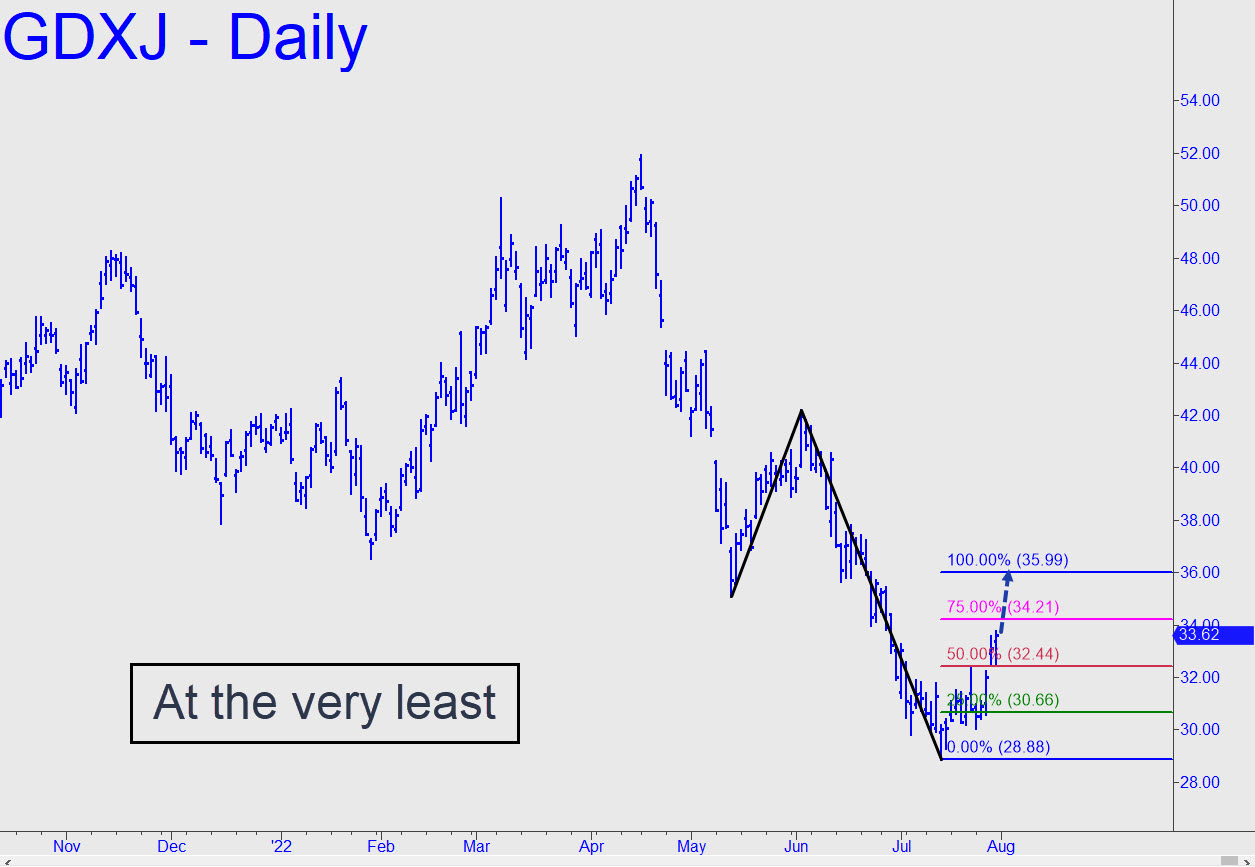
Much as I’d like to put the knock on last week’s rally, it actually looked pretty good — real, almost. In the reverse pattern shown, buyers showed no awareness whatsoever of what we might have viewed as daunting resistance at p=32.44. Thursday’s gap through it all but guaranteed a finishing stroke to D=35.99, but we’ll need to see how buyers handle this Hidden Pivot before we literally buy into the likelihood of a move into the wild blue yonder extending up to  early June’s 42.19 peak.  This suggests imminent weakness in energy prices that have been holding mining stocks down, perhaps even moreso than the strong dollar. _______ UPDATE (Aug 3, 4:30 p.m.): A pullback to the green line (x=30.66) would trigger an appealing ‘mechanical’ buy, stop 28.87.

TNX.X – Ten-Year Note Rate (Last:2.64%)

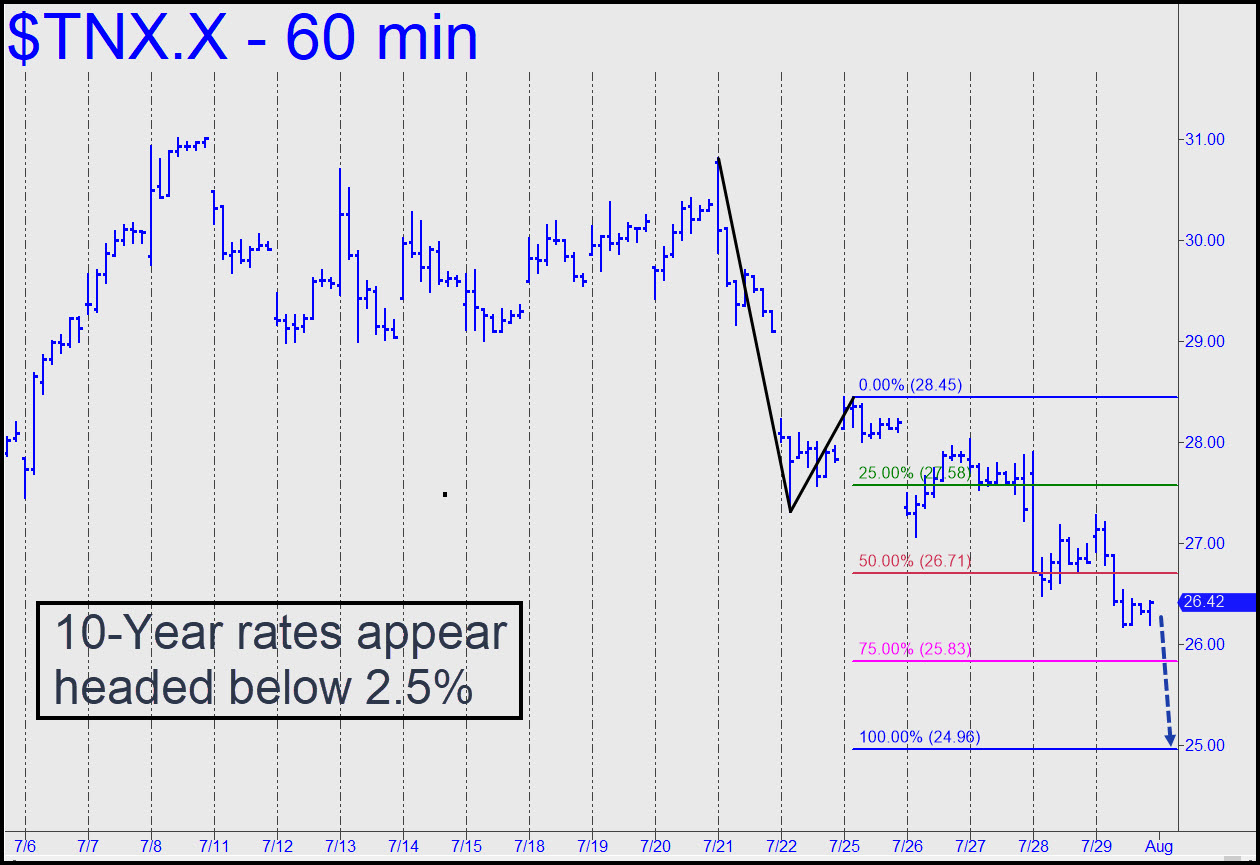
The A-B leg is sufficiently compelling that we can infer rates on the 10-Year Note are on their way down to at least 2.49%, a hair beneath the psychologically important 2.50% level. That would be a good place for a pause, but it is more likely that we’ll see a bounce. It’s too early to tell whether this would be the start of a strong, bullish reversal, but if so, it holds bullish implications for the big banks, if not for other sectors of the U.S. economy.  Alternatively, if D=2.49% is easily penetrated, it would imply ore slippage down to 2.30%, or even 19.10%. Both targets come from a reverse pattern on the monthly chart.

CLU22 – September Crude (Last:88.94)

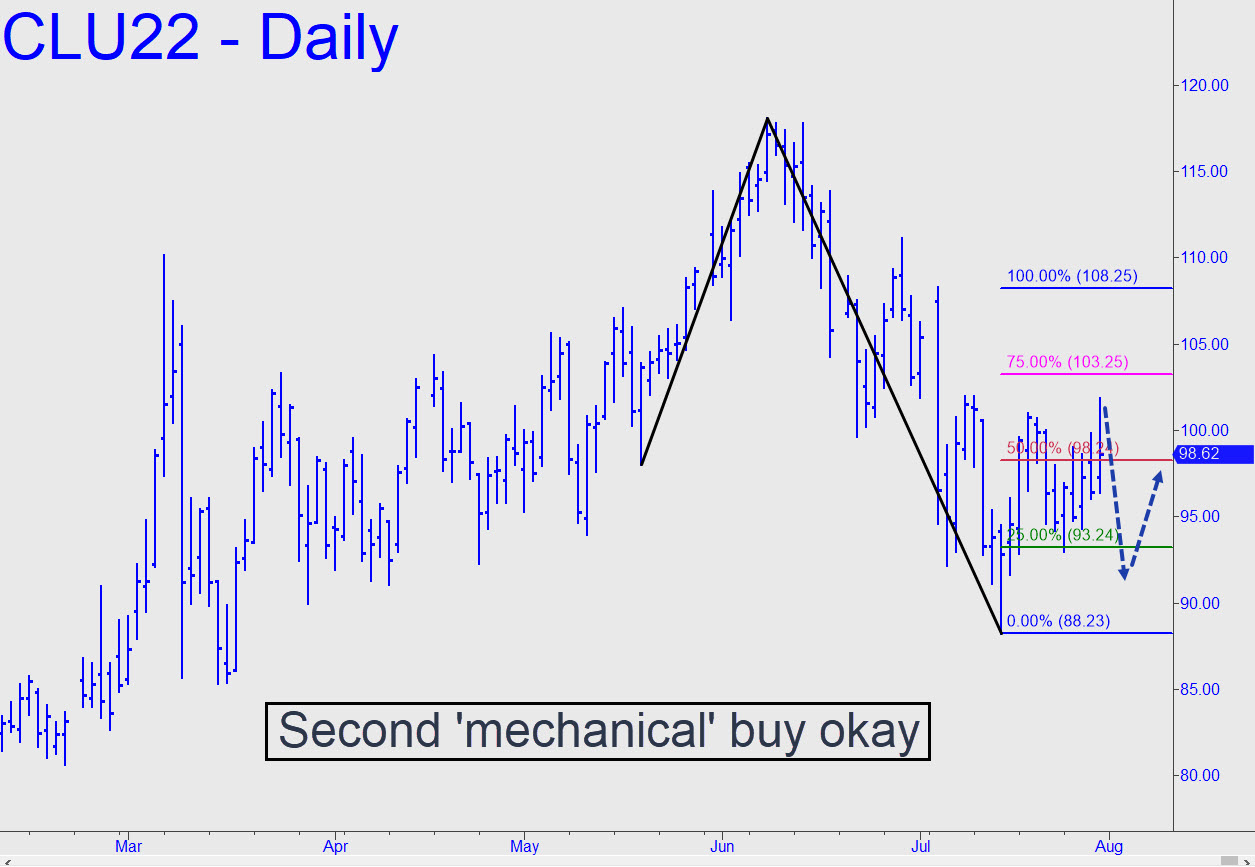
I’d advised against bidding ‘mechanically’ at the green line if September Crude should revisit it, but Friday’s impulsive thrust was powerful enough to suggest that ‘sloppy’ seconds could produce another $5000 winner like the one that played out over two days last week. That implies a ride from the green line (x) to the red (p), a climb that doesn’t look too challenging when visually imagined. Regardless, and unless there’s a swoon exceeding C=88.23, the 108.25 target will remain theoretically viable. _______ UPDATE (Aug 1, 10:48 p.m.): Yes, the plunge to the green line has triggered a mechanical buy, the second such signal from this pattern. My gut feeling is that the futures will achieve p=98.24, good for a one-level ride, but I am not recommending the trade unless you know how to ‘camo’ the entry risk down to perhaps 5% or less of the implied $20k (on four contracts) if C=88.23 were to be stopped out.  ______ UPDATE (Aug 4, 10:54 p.m.): My gut feeling was wrong, for oil is weaker than I’d imagined. Even so, the September contract should get a bounce from here, since bulls got stopped out with today’s dip below C=88.23 of the reverse pattern.