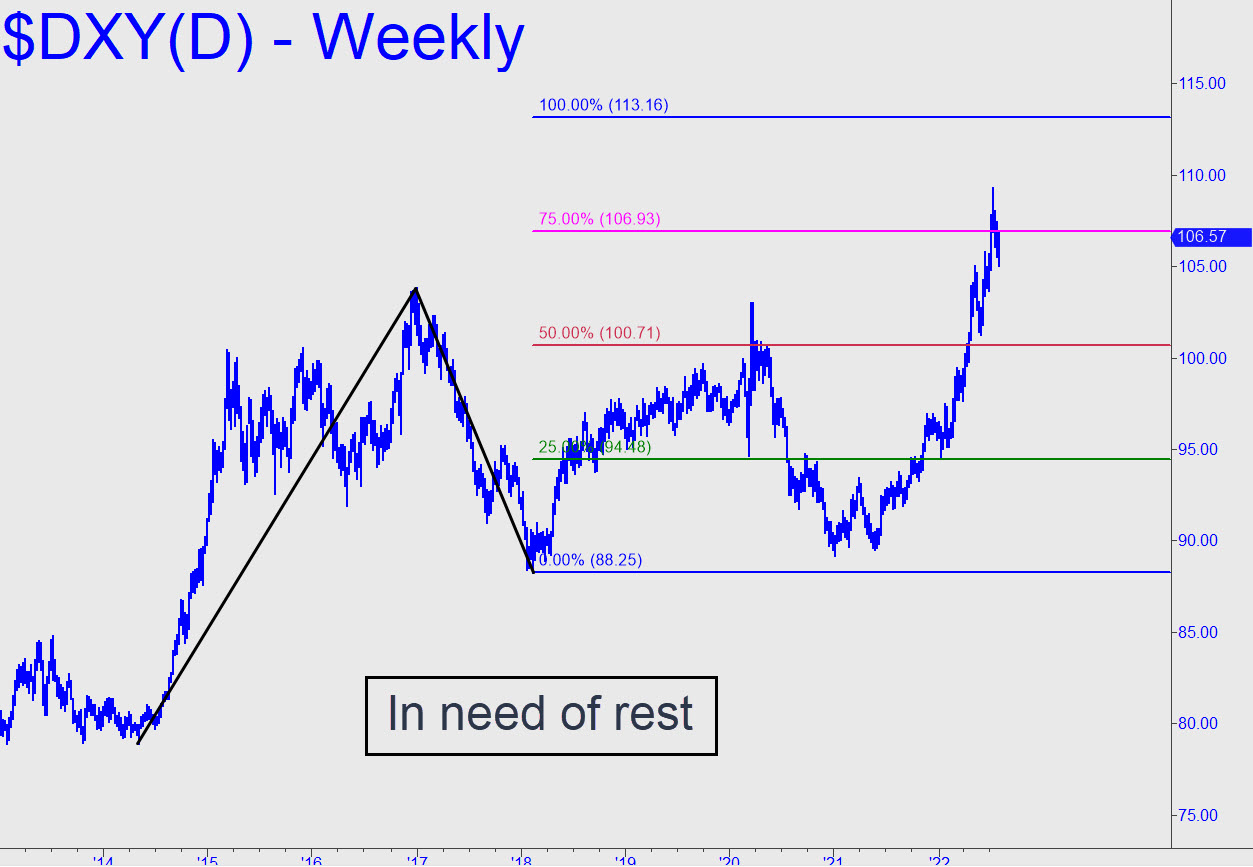
 After a scorching rally that lasted 14 months, the dollar needed a rest. It could pull back to 97.63, and that would be a mere ten percenter and presumably healthy, as I mentioned here earlier. But the long-term chart (see inset) suggests that even if the selloff were much worse — say, to below 95 — that would generate an appealing ‘mechanical’ buy at the green line. No doubt the talking heads would be proclaiming the greenback’s demise. But in purely technical terms it would provide a Hidden Pivot springboard for a shot at the 113.16 target. I doubt we’ll see a correction that nasty, and we’ll be looking in any case for a ‘mechanical’ buying opportunity if and when the red line (p=100.71) is hit. In the meantime, let’s focus on the lesser charts for signs of an upturn well shy of the worst-case levels identified above. That would imply minor abcd downtrends that do not reach their targets but instead reverse from p.
DXY – NYBOT Dollar Index (Last:106.57)
