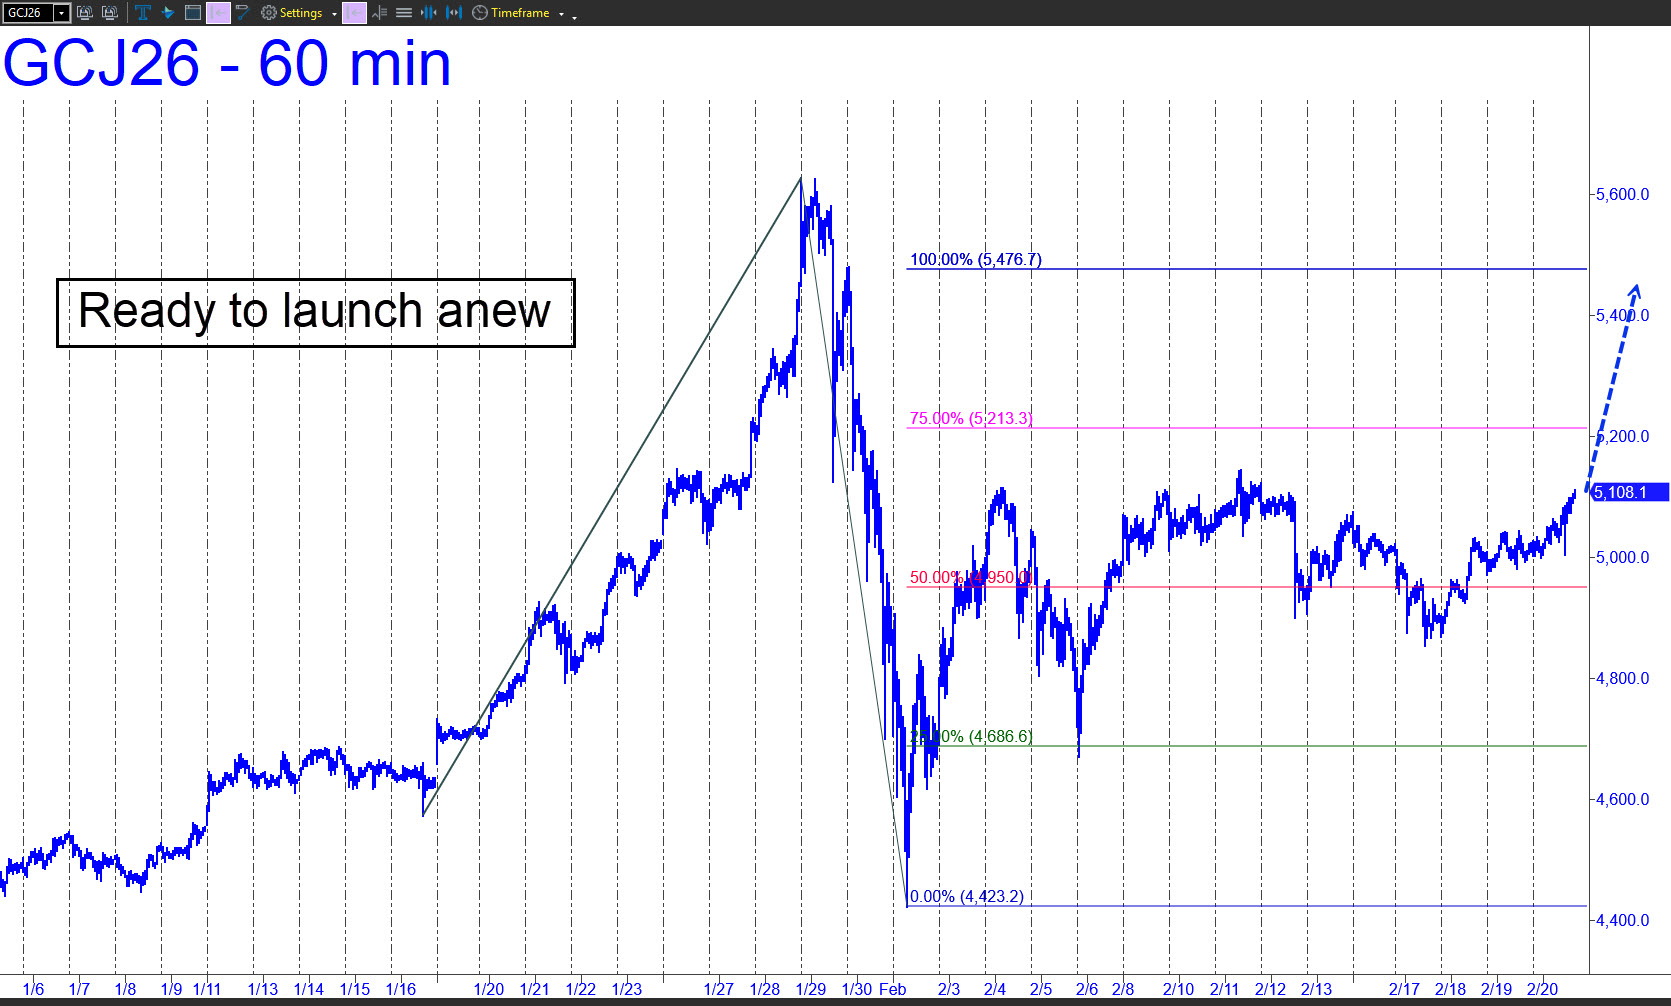
 The bullish view of Gold (see inset) is somewhat different from the one shown in the current Silver tout. Both were on ‘mechanical’ sell signals, and that is what the latter chart was intended to visualize. However, this chart has taken the further step of extrapolating the next, likely rally leg. It projects to 5476.70, and while price action at the 4950.00 Hidden Pivot midpoint does not quite guarantee the target will be achieved, it’s a reasonable bet as a minimum upside objective for the week ahead. A stall at p2=5213.30, the secondary Hidden Pivot, would confirm that the pattern shown will continue to control Gold’s movement until such time as 5476.70 is achieved.