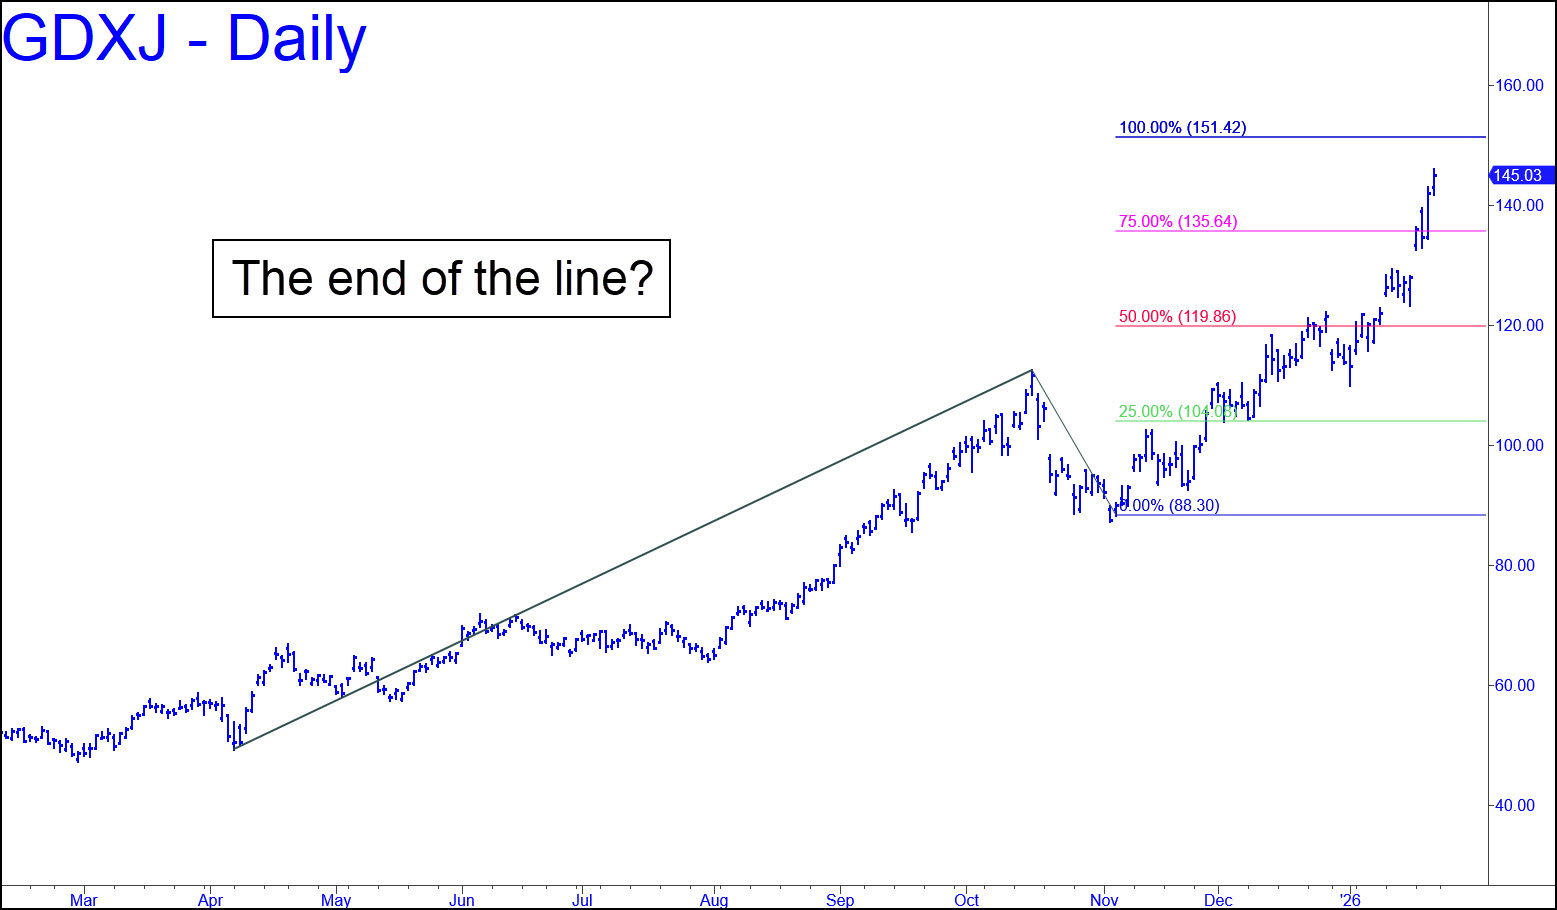
 The chart replicates the pattern I’ve used to project a 5300 target for Feb Gold. The corresponding target for GDXJ is 151.42, and although the pattern, like the one for gold futures, starts with an un-kosher point ‘A’ low, it should prove more than good enough for government work. In fact, it provides an anchor that visually suggests that 151.42 will be a resistance point of consequence. It is the highest target I can project with unexceptionable coordinates. Using a longer-term chart here is not particularly useful for creating new point ‘A’ beginnings because it would simply recall whatever relatively undramatic lows occurred with GDXJ trading beneath $40. Some of the ups and downs back then may have felt like a big deal, but in the context of the big move up that has occurred since August, they were just grassy bumps on a rural airstrip. _______ UPDATE (Jan 26, 12:02 p.m.): Like much else in the bullion world, GDXJ has gone all lunatick-y, starting today’s session with a wildly exuberant gap to the 151.42 target advertised above. It has spent the day so far diddling this Hidden Pivot, but the already 70-cent overshoot has practically guaranteed still-higher prices. I am able to project them only by using ‘extension patterns’ along the Big Picture’s C-D leg, but what would be the point? Query me in the chat room if you get desperate for further guidance. _______ UPDATE (Jan 27, 9:45 p.m.): If buyers shred their way past a Hidden Pivot midpoint resistance at 148.99, assume they are bound for 158.51 (60m, A= 133.08 on 1/21). A secondary ‘hidden’ resistance ay 153.75 could slow them down.
GDXJ – Junior Gold Miner ETF (Last:147.43)
