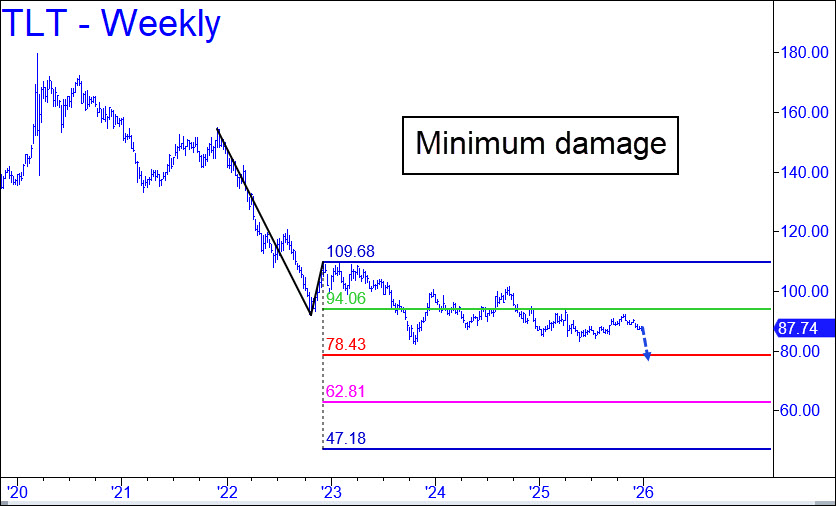
Although T-Bond prices have been skittering sideways for more than three years, a further fall in this U.S. Bond proxy to at least 78.43 seems unavoidable. (Note: The numbers have been adjusted somewhat to reflect the more precise picture afforded by the weekly chart.) This implies that rates are headed higher, since they correlate inversely with T-bond prices. Yields on the 30-Year were at 4.82% when last week ended, but we might expect them to rise to around 5.5% if TLT falls to 78.43, a midpoint Hidden Pivot support. That would seem to be enough to pop the financial bubble, although we shouldn’t underestimate Trump’s ability to keep it intact for yet more months. _______ UPDATE (Jan 16): A sharp rally toward the end of the week created a minor impulse leg on the daily chart before a relapse on Friday wiped out the gains and then some. Let’s see whether bulls can follow up with a C-D leg that surpasses the 88.83 high recorded on December 11. If they succeed, it could turn the short-term picture less-than-dismal.
TLT – Lehman Bond ETF (Last:87.74)