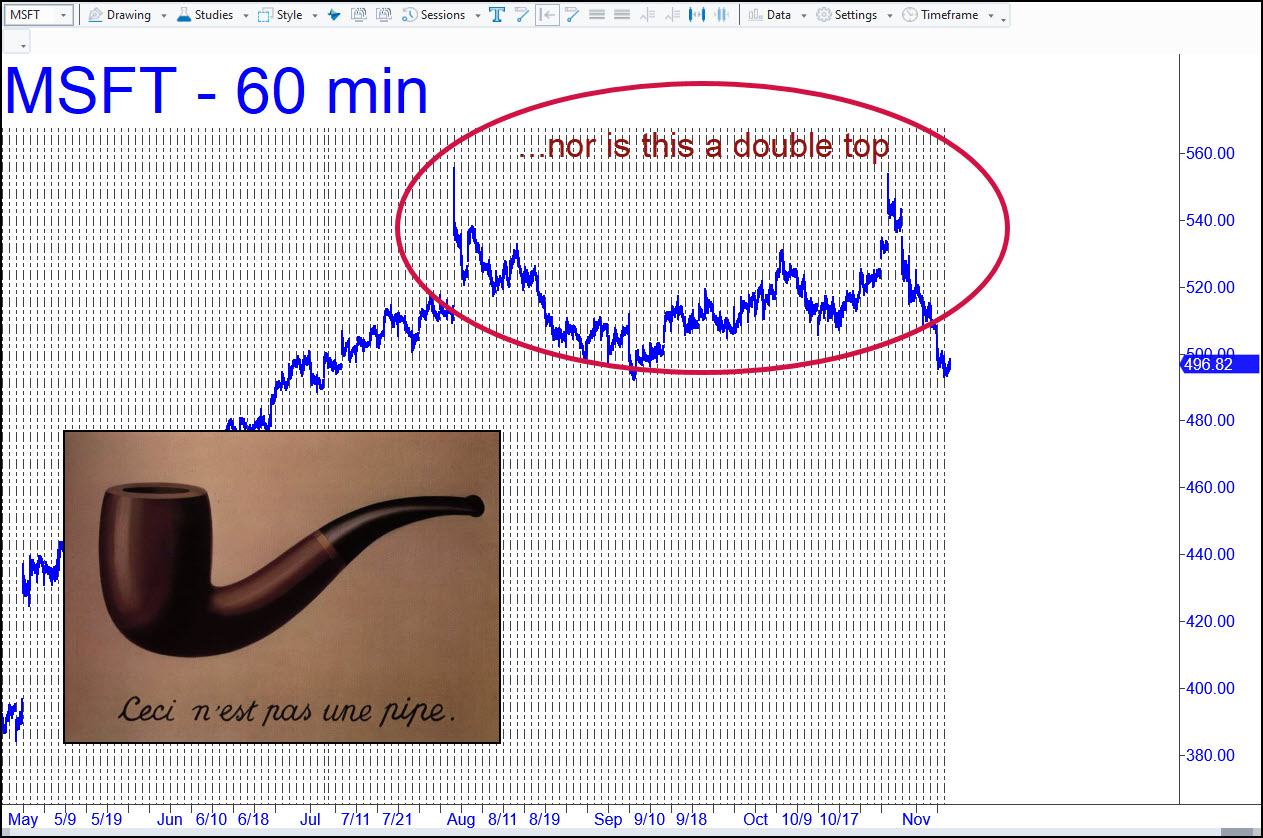
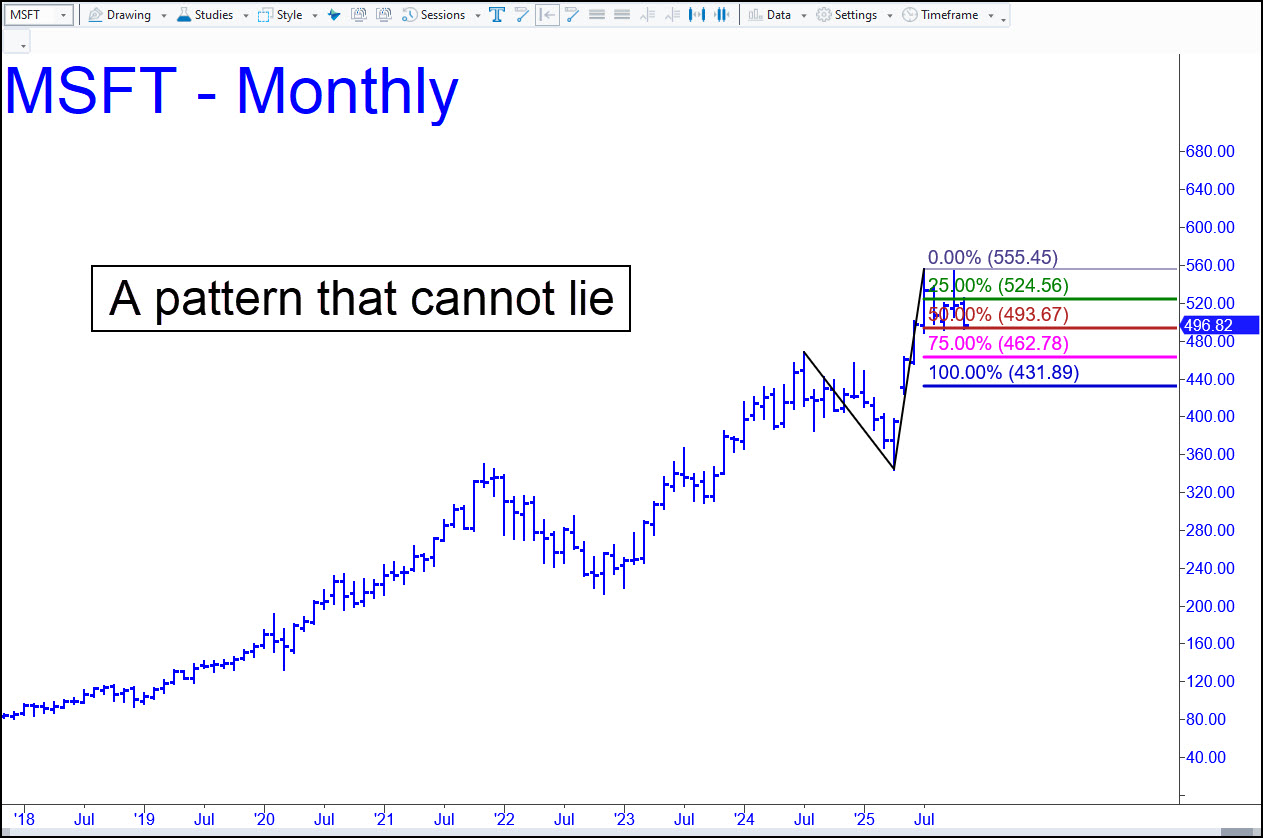
 It’s a stretch to compare Magritte’s famous painting to Microsoft’s chart, but here goes. The Belgian artist’s point was that you could not stuff a two-dimensional representation of a pipe with real tobacco. Should we therefore try to divine Microsoft’s future just because its stock chart features an in-your-face double top? I read it as bullish because it’s too obvious to be bearish. So, how should we trade it? A reverse-pattern, long-term rendition of the chart will simplify this task. It is saying the stock will become a back-up-the-truck buy when it falls a further 13% to 431.89. I will also assume, speculatively at the moment, that a breach of the midpoint Hidden Pivot support (p=493.67) is very likely. When it happens, that will cue up p2=462.78 as our minimum downside objective. Worst case for the intermediate term: 431.89, the ‘D’ target. We can infer that the stock market’s performance will mirror MSFT’s. That means, although a sharp drop lies ahead for the broad averages, it won’t necessarily signal the end of the nearly 17-year-old bull market.
MSFT – Microsoft (Last:497.65)