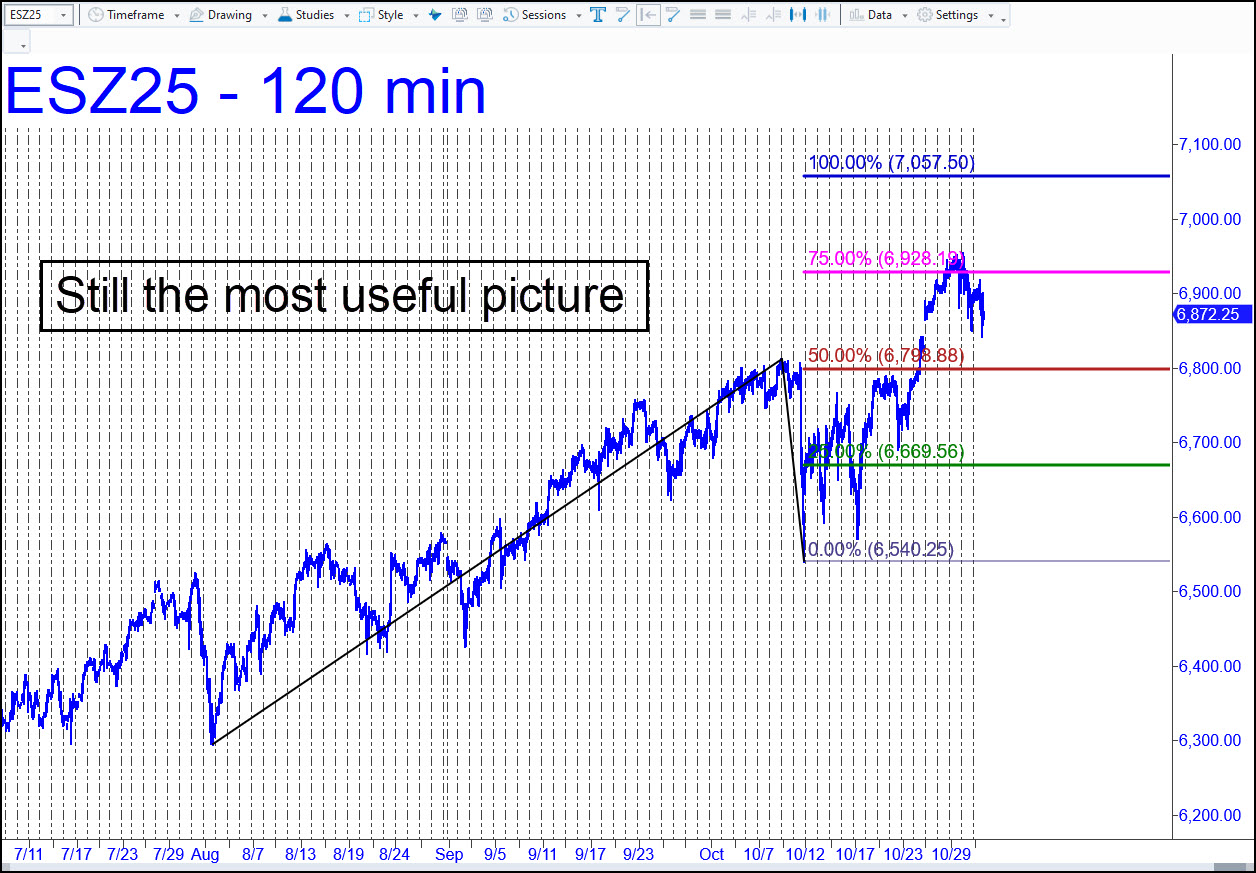
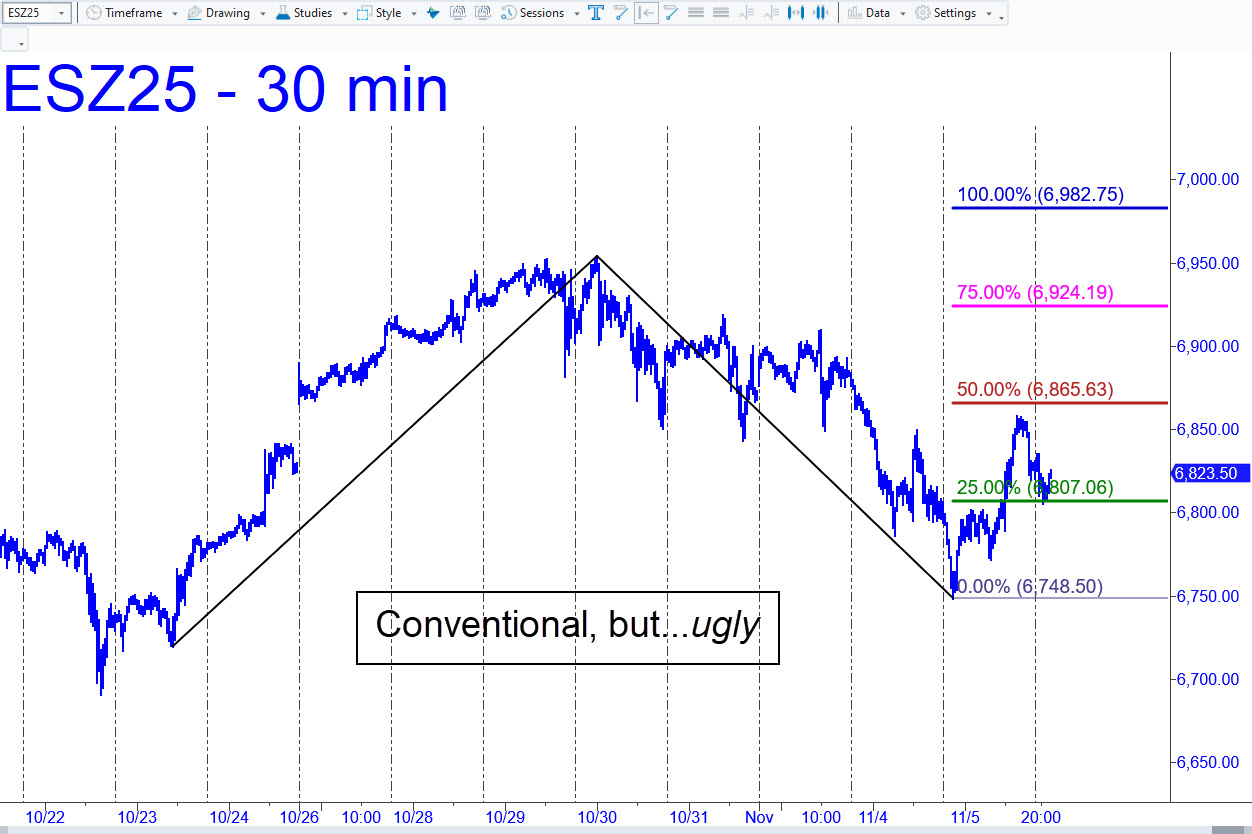
 Even with its unusually elongated A-B leg, the pattern shown remains the best source of tradable information we have for the runaway bull market. Price action at p suggests the 7057.50 target is likely to be reached, but until it is decisively breached, we won’t concern ourselves with a still higher target at 7531.25 that was identified here earlier. As you can see, the pattern also leaves room for a few scary corrections along the way. The current one will need to come down to the red line (p=6798.88), however, before I suggest buying there ‘mechanically’. We usually do these trades on pullbacks to the green line, but in this case, given the steepness of the uptrend, that opportunity may not materialize. The ‘textbook’ stop-loss for this trade would be at 6712.50, but in practice, we would use a ‘camo’ trigger to pare down theoretical entry risk by at least 90%. _______ UPDATE (Nov 3, 2:35 p.m.): Today’s refreshing plunge has brought greater clarity to the immediate outlook. You can expect the futures to fall to a tradable low at 6681.75. If they rally first to 6885.7, short the crap out of them, stop 6954.00. The latter trade should be done only with a ‘camo’ trigger that cuts theoretical entry risk to no more than $400 per contract, and only if you’ve caught a profitable piece of the ride up. ______ UPDATE (Nov 5, 2025): DaBoyz used every sleazy trick in the book to spike ES (see my explanation in the chat room), but they couldn’t even goose it to the red line (p=6865.63) before buyers turned tail at day’s end. Use the pattern shown, ugly but serviceable, to determine whether They will eventually succeed. A decisive thrust past ‘p’, especially followed by a close above it, will imply that dangerous new hjghs are coming.
ESZ25 – December E-Mini S&P (Last:6823.50)