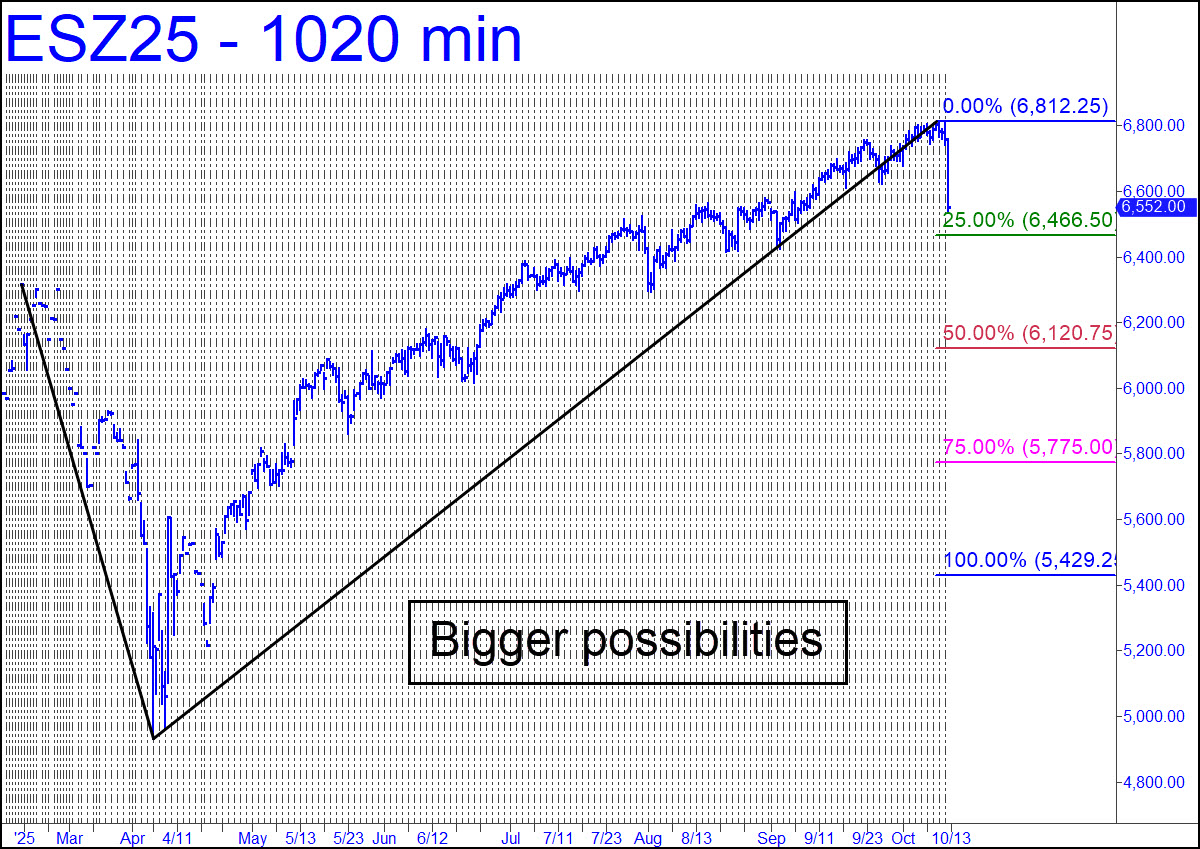
Sellers exceeded a compelling ‘hidden’ support at 6582 that I posted in the chat room on Friday, implying they will likely return in force this week. The reversal off a strong opening was unusually severe, even for a Freaky Friday, and I am therefore treating it as the possible start of a full-blown bear market. My reasons are detailed in the current commentary, but the grim technical implications are shown in the chart (inset). A 6.6% fall to at least p=6120.75 is indicated, but this is admittedly speculative, since the futures have not yet touched the green line (x=6466.50) to trigger a theoretical short. There is an alternative, minimum downside target at 6315.75 that we should monitor closely, but I have decided not to feature such half-baked scenarios because I believe Papa Bear has at last emerged from his lair after hibernating for 16 years. Incidentally, a voodoo number above 6300.00 will be worth bottom-fishing in any case, but since it is proprietary, I have posted it in the chat room. ______ UPDATE (Oct 13, 10:45 p.m.): Check out my 4:45 a.m. post in the chat room for guidance on getting long in this vehicle, and then shorting it at 6741.50. I’d suggest a small-pattern trigger (a.k.a. ‘camouflage’) for the latter trade. _______ UPDATE (Oct 15, 11:10 a.m. EDT): The trade triggered and was quickly stopped out for a $700 loss per contract. Although the pre-opening, overnight high at 6741.00 missed my Hidden Pivot target by just two ticks, it thereupon became a ‘number of interest’ when the high sat for an hour-and-a-half to be anxiously contemplated by traders ahead of the bell. The most important takeaway here: ES was a good short only if it was cushioned by profits made en route to the target. The odds of catching a profitable uptrend will always be better than attempting to intercept a missile that has been rocketing higher for most of the last 16 years. _______ UPDATE (Oct 17, 2:39 p.m. EDT): ES has tripped a ‘mechanical’ short at 6700.19, stop 6767.00, that is predicated on a 6500.50 target. I’m using a 480-minute chart, where A= 6806.50 on 10/10.
ESZ25 – December E-Mini S&P (Last:6708.00)