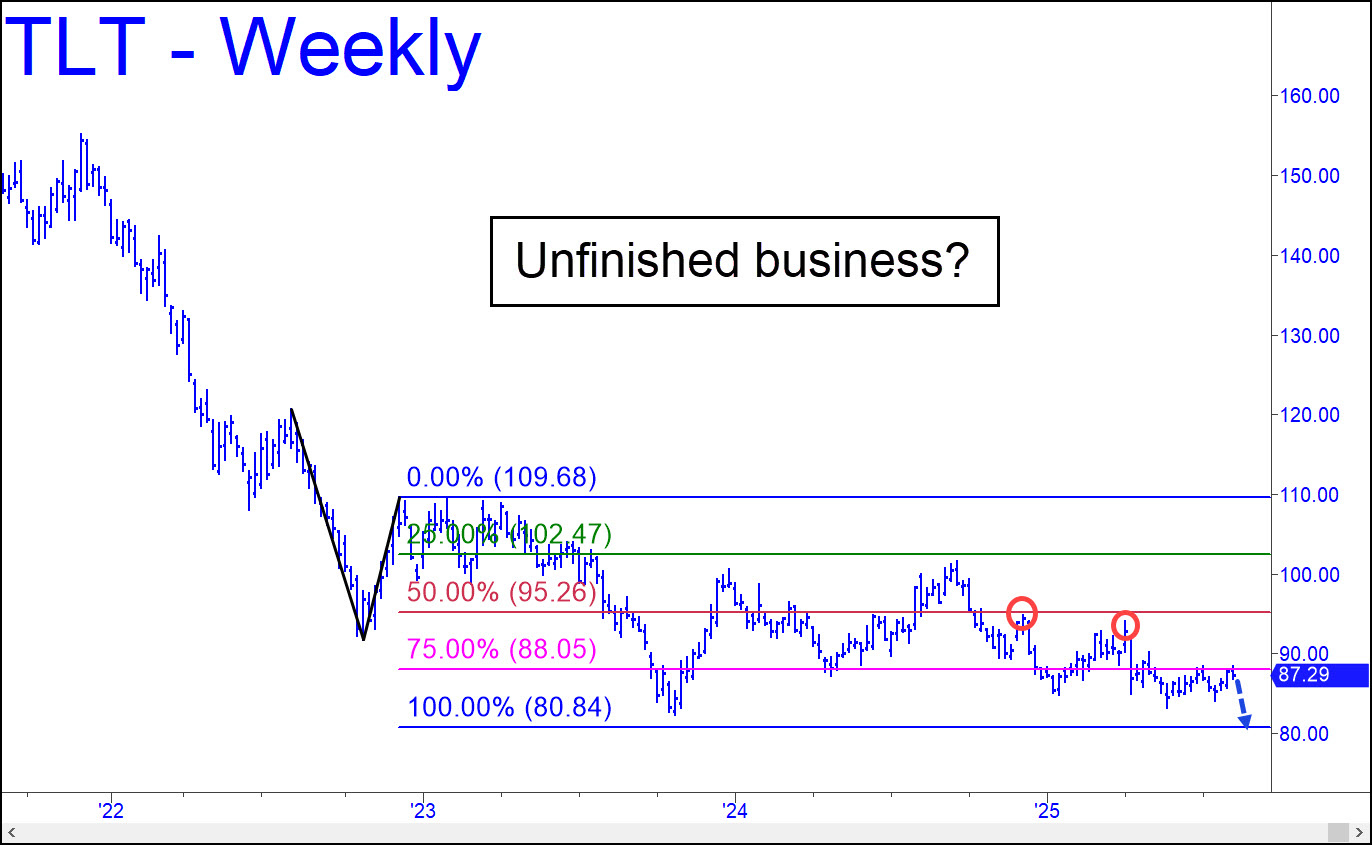
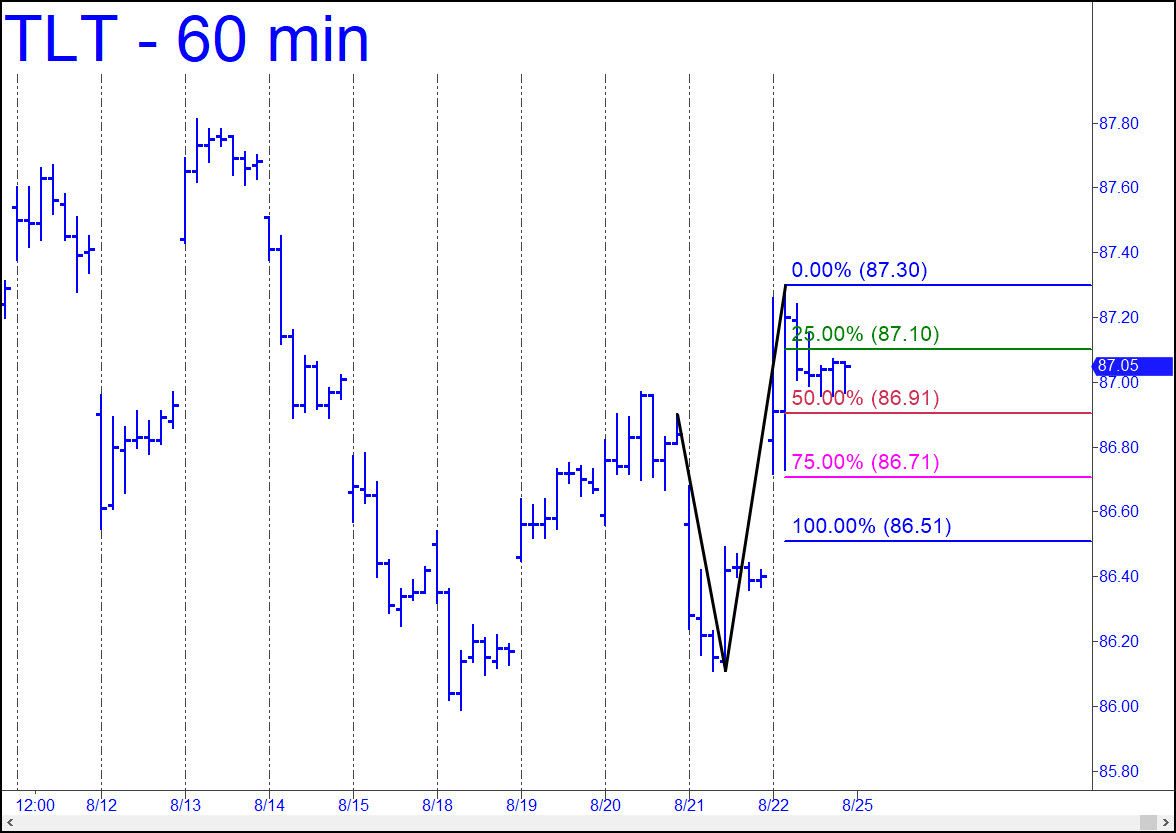
 TLT’s performance over the last four years has grown increasingly painful to watch, and there are no clear signs this is about to end. In fact, a little more downside remains to complete the pattern shown to D=80.84. Alternatively, I’d need to see an uncorrected thrust above both of the circled peaks to infer that an important reversal is under way. Barring that, we should assume that more downside to at least 80.84 awaits; or if any lower, to 74.79 (! ) (Weekly chart, A= 108.87 on 4/7/23). _______ UPDATE (Aug 22): You can chase boredom by monitoring TLT’s passage along the route of the reverse pattern shown. p=86.91 is a good place to bottom-fish by scalping options or the underlying, but we’ll also be able to use the pattern to gauge trend strength, such as it is. ________ UPDATE (Aug 31): Zzzzzzzzzzzzzz.
TLT – Lehman Bond ETF (Last:87.05)