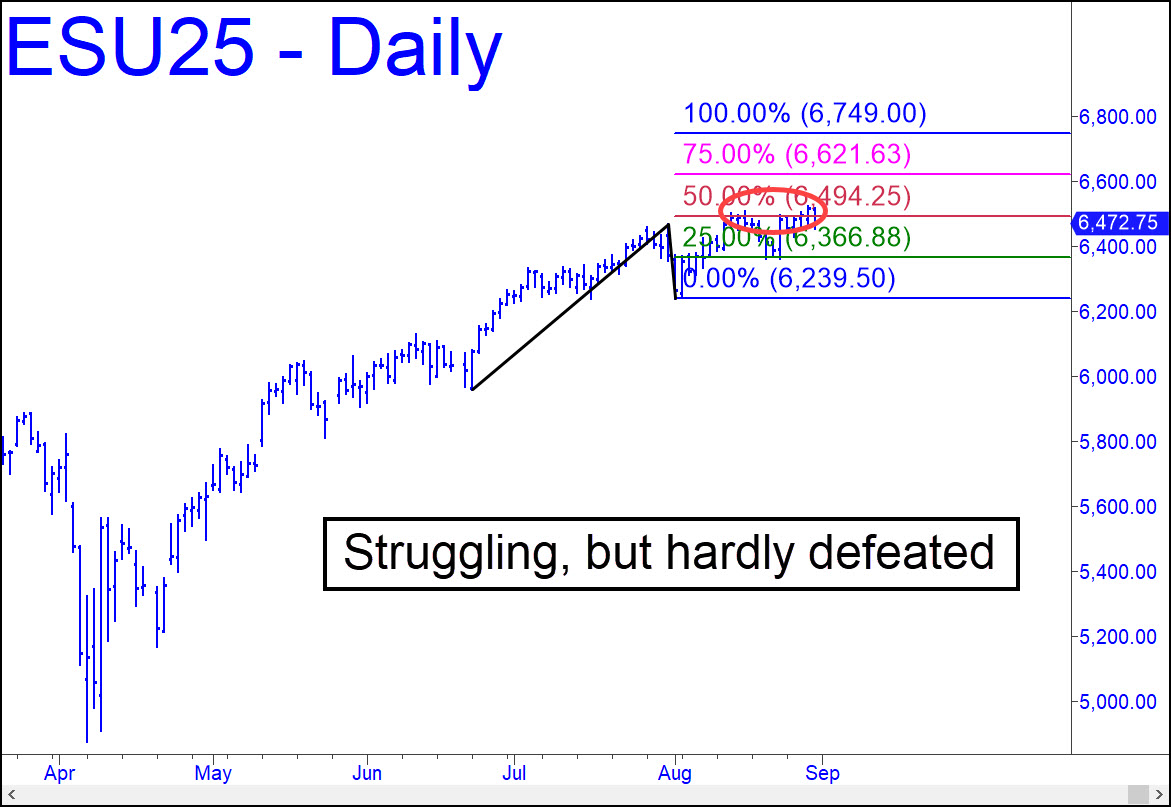
The struggle to surpass a stubborn midpoint Hidden Pivot at 6494.25 has consumed bulls for more than two weeks and made a follow-through to D=6749.00 less than the usual sure thing. However, we are obliged to give the uptrend the benefit of the doubt, since it has routinely swept aside every technical resistance it has encountered over the last 16 years. This particular pattern has already rewarded ‘mechanical’ buyers at the green line (x=6366.88) with a quick, fat profit of nearly $15,00o per contract. It would be no detriment to the chart’s bullish look if that were to happen again, yielding what I would ordinarily call ‘sloppy seconds’. Alternatively, a breakdown below C=6239.50 would probably signal the beginning of the end. However, the sideways hesitation at these heights does not look sufficiently dramatic to cap the most spectacular bull market in history. Wouldn’t you agree?
ESU25 – Sep E-Mini S&Ps (Last:6472.75)