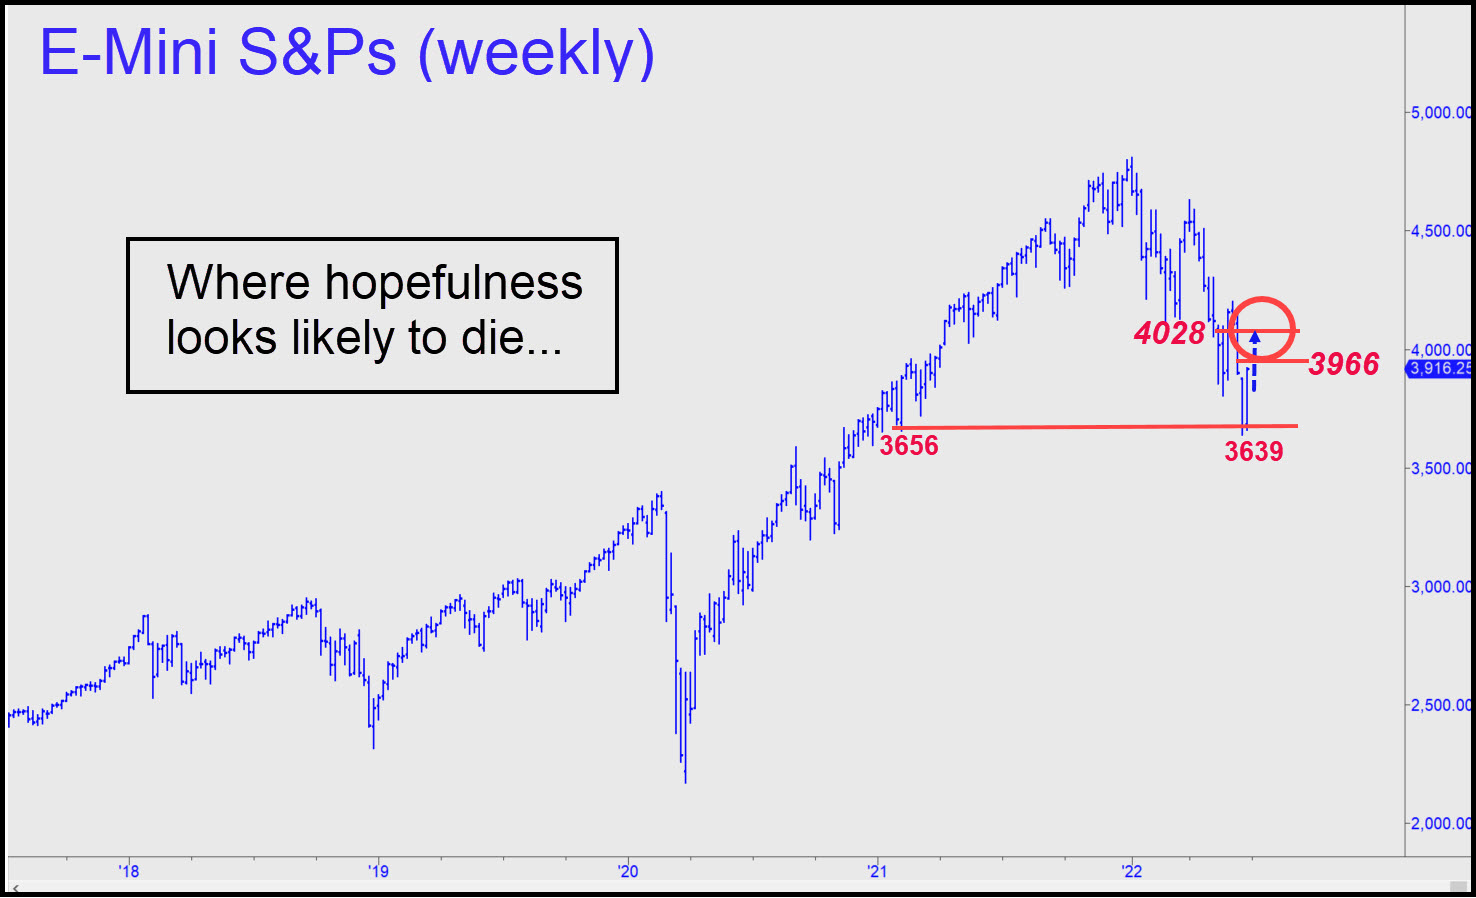
The chart above is intended to take some of the guesswork out of determining how high this presumably doomed stock-market rally is likely to go. Not very, would be my guess. I say the rally is doomed for a few reasons, none of which has anything to do with a U.S. recession that began months ago, or a real estate collapse that is still in the anecdotal stage but quite real and menacing nonetheless. My assessment is based purely on certain subtle technical signs evident in the chart. First is the S&Ps’ breach of a 3656 ‘external’ low recorded back in February. The overshoot was just 17 points, or 0.46%, but that was sufficient to generate a strong impulse leg of weekly-chart degree. What it implies is that any rally off the June 17 low will turn out to have been corrective — or to use a more descriptive word, distributive.
Since we ‘know’ the rally is just a bear squeeze, predicting where it is likely to apex is possible. I have used a ‘reverse-pattern’ feature of the Hidden Pivot Method to calculate prospective rally targets at, respectively, 3966 and 4028. If the S&P mini-futures were to exceed the first by more than 5 or so points intraday, that would imply more upside to the second. Both are bound to show stopping power sufficient to be short-able, and that is what I would suggest to Rick’s Picks subscribers.
Sidestepping a Possible Stampede
This scenario is by no means chiseled in stone, and I would be inclined to give the rally wide berth if it impales the higher number the first time it is touched. That would suggest that a bear rally worthy of the name is under way. If so, it could be expected to continue to whatever height is necessary to cause even your editor to think new all-time highs are possible. So far, though, bears have hung tough, refusing to be spooked into short-covering that would allow portfolio managers to distribute shares to the rubes at fat prices.
In the meantime, as we know, horrendous headlines concerning the economy are rarely sufficient to crash a stock market. But U.S. shares will not long remain a relative oasis for investors when the global economy starts to implode. This is certain because a strengthening dollar has made oil and everything else paid for in dollars increasingly unaffordable for most of the world. Americans benefit from this, but it is the growing cost of paying off debts in strengthening dollars that will be their undoing. Oil prices will plunge in the global downturn, but any relief this will bring at the pump will be overwhelmed by the broadly ruinous effects of debt deflation.
Comments on this entry are closed.
More on Rick’s Debt Deflation.
Joseph Schumpeter described Irving Fisher as, The greatest economist the United States ever produced.
This claim was later repeated by Nobel Laureates James Tobin and Milton Friedman.
Like Keynes at Kings College Cambridge, Fisher was first in maths in his Yale class of 1888, where he stayed his entire career, tapped by Skull and Bones.
In Oct 1929 Fisher told the Harvard Economic Society (HES), Stocks have reached what looks like a permanently high plateau.
This claim was repeatedly echoed by HES, President Herbert Hoover, NYT and other leaders of industry on the way down, with counter-rallies.
Days after Plateau came Black Thursday, Black Monday and Black Tuesday crashes of October and November 1929 totaling – 48 %, emptying all but the deepest pockets.
Wall Street Bankers and Titans of Industry stepped up and into the market as defacto private plunge protection team.
The market rallied + 48 % in five months to April 1930, when it fell another – 86 % until July 1932, totaling – 89 %.
Fisher, who managed the Yale Endowment, and most Americans in the market were financially ruined.
Claims that it can’t happen again because we no longer have 10 % Down stock margins, are rebutted by options with far greater leverage and total expiration.
The market did not recover in nominal prices for 25 years until 1954, after Depression, Hyperinflations, Korean War and World War II, with the rise of Franco, Hirohito, Hitler, Mussolini and Stalin.
In real gold prices, the market did not recover until 1966, 37 years later, after gold was outlawed by FDR in 1933 with Executive Order 6102 to reinflate the economy with debt and fiat disguised defaults.
The 1966 real market recovery was five years before Nixon ended gold trade settlement in August 1971.
He put in price and wage controls that failed and ended with his impeachment resignation for Watergate, a third rate burglary committed by a clandestine government agency.
Today gold is not so much outlawed as manipulated by central bankers and their brokers with unlimited credit lines and seigniorage.
The annual supply of money to gold production is $13,989/ounce, a far cry from the $10/oz US Mint Act in 1792 or $18.92 price in 1913 before the Fed and IRS were invented.
Despite ferocious + 50 % bear market rallies, most who held long term or tried to buy the bottom were wiped out.
A famous New Yorker cartoon showed the 1929 down market staircase and asked in 1932, Is THIS The Bottom ?
(It was, though few could profit.)
Fisher attempted to pick up the pieces of his academic career by inventing Debt Default Deflation Depression Theory that was largely ignored until the market hit new highs after his death.
The theory stated markets rally until the debt funding them can no longer be serviced.
We approached that point in 2000 and 2008.
We may be there again, according to Big4 Insiders and
Whoops, this posted before finished.
One correction: US Mint Act of 1792 defined ounce of pure gold as $17.68. The $10 Gold Eagle was 0.5657308 oz, 0.617225 oz gold standard alloy. Silver based on the Spanish Dollar, which was US legal tender until 1857, and 95 % copper backed pennies, now worth three times face value, so replaced with copper clad 97.5 % zinc.
With the current gold price, the dollar lost over 99 % of its value after FDR in 1933 replaced gold certificates with Federal Reserve Notes backed by Treasury Debt, and Nixon in 1971 replaced gold trade settlement with fiat. JFK issued silver certificate dollars, then silver was removed from money after his assassination in 1963.
One completion: Big4 short Treasury debt and PnF targets 4.859 % on TNX.
Interest on Treasury Debt tripled to $438 Billion, making it largest budget item after Medicare, Social Security and Defense.
Caught in a trap, as Elvis sang.
Best way out of the debt trap
may be something like GOLD,
now less short by Big4,
PnF Target + 98 % from 18.915 to 37.5
Thanks for the scholarly discourse, Richard. Fisher didn’t deserve such notoriety, but it was unavoidable given the perfect timing of his eternally memorable quote.
RA
Thank you Rick.
We would be remiss in this bearish vein
If we did not share our Bitcoin target of – 77 %
From 20,138.926 to 4645.44.
Oversold, may bounce to 28.194.55 and still head down.