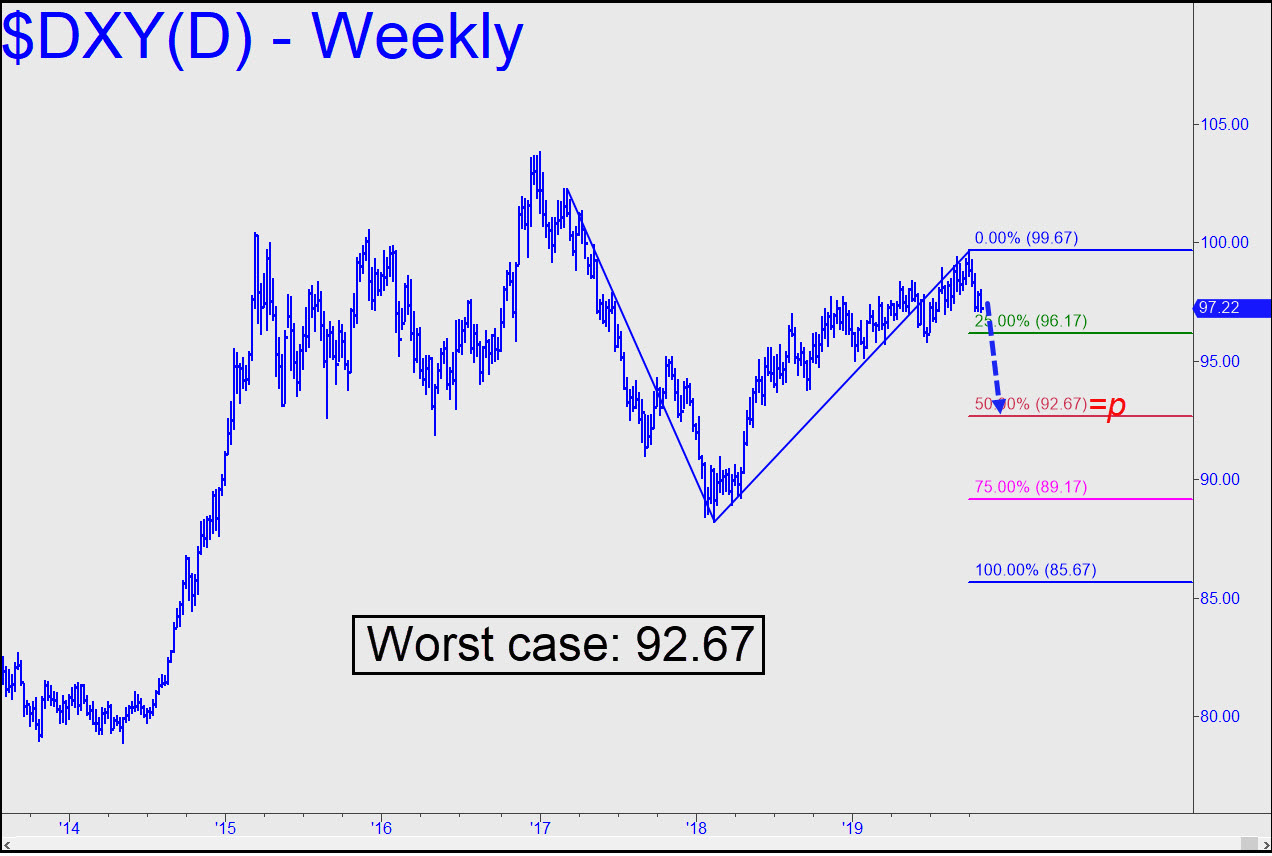
 I rarely update my dollar forecast because 1) my very-long-term outlook is unshakably bullish, and 2) subscribers do not trade it. Nevertheless, the dollar sold off hard last month, raising mild concerns about whether the long-tern trend has changed. A glance at the weekly chart, however, reveals little technical damage. Regardless, I’ll need to start treating the chart as I would some trading vehicle I don’t care about. Strictly speaking, a further decline touching the green line would put p=92.67 in play as a downside target. I refer to it as my worst-case scenario in the chart, but in fact 85.67, the pattern’s ‘D’ target, would be the actual worst-case possibility. That is unimaginable to me, and so I’ve put it out of mind. ‘Impossibilities’ aside, I’ll be watching for ‘counterintuitive’ buying signals each time DXY takes out a new low on the weekly chart. The nearest of them lies at 97.03, and thence at 95.84. _______ UPDATE (Nov 8): Interesting that a market as vast as the dollar should rally following a cheesy fake-out low that exceeded a previous one by a few cents. That is what has happened, however, as this chart makes clear. The rally would look more sincere if and when it exceeds the external peak at 98.65. _______ UPDATE (Dec 4, 6:44 p.m.): The greenback has taken a moderate fall after going no higher than 98.54, just 12 cents shy of our bullish trigger price. The weakness would become significant if it exceeds the 97.03 low recorded on August 9.
DXY – NYBOT Dollar Index (Last:98.37)
