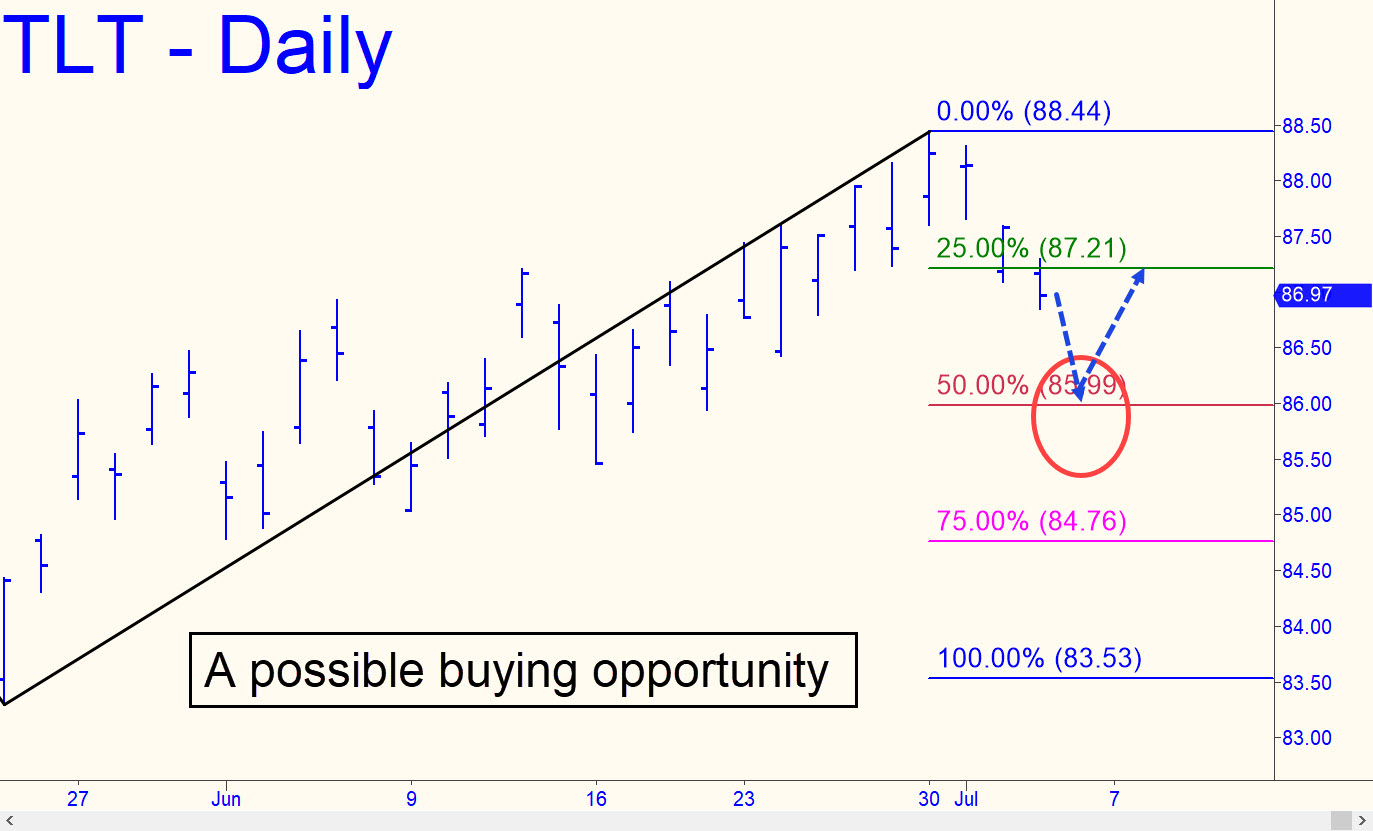
 TLT weakened last week after creating a bullish impulse leg on the daily chart, generating a theoretical sell signal in the process. If the so-far moderate decline is merely corrective, we should see a tradable rebound from the 85.99 midpoint Hidden Pivot support shown in the chart (inset). That is what I expect, but if the support gives way, especially on a closing basis, expect the slippage to continue down to at least p2=84.76, or even to a worst-case d=83.53. That would leave the important low at 83.30 recorded on May 22 intact, but only barely.
TLT – Lehman Bond ETF (Last:86.99)
