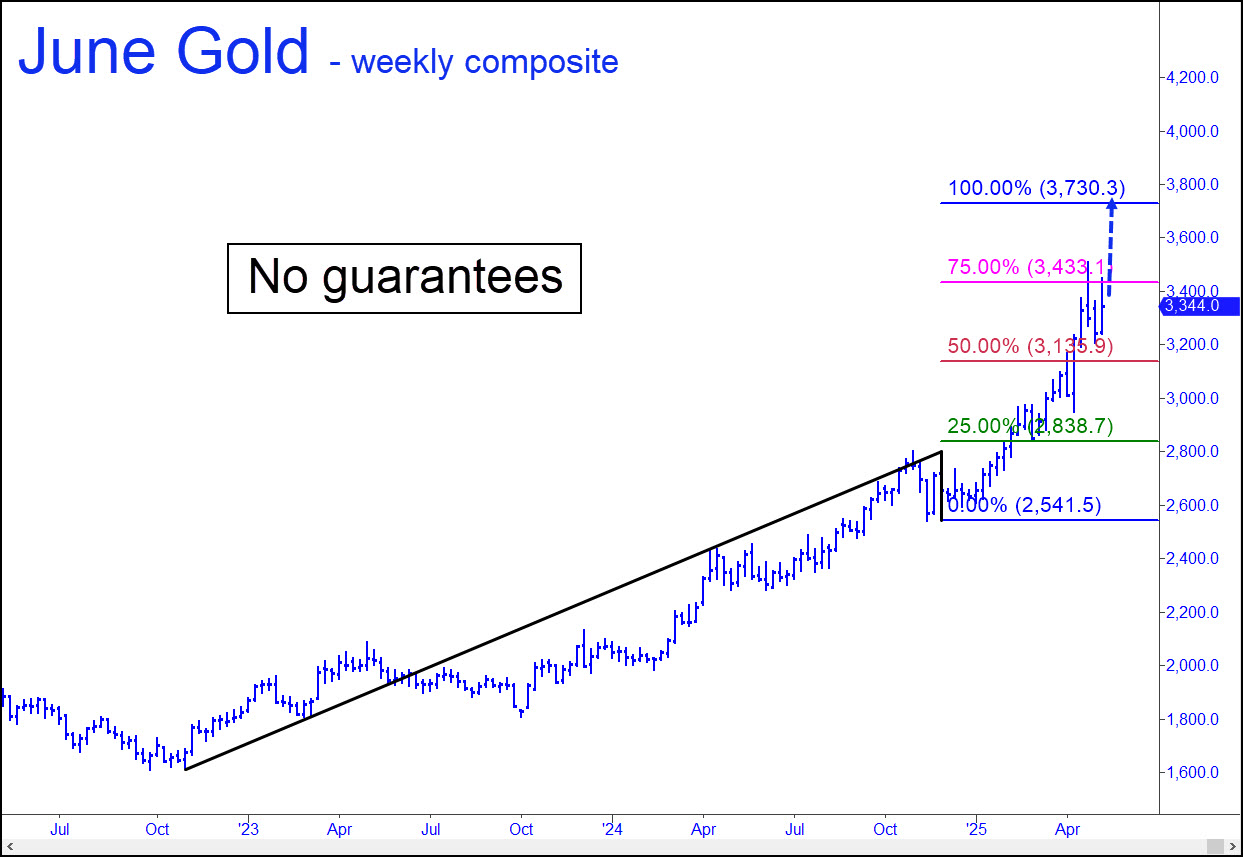
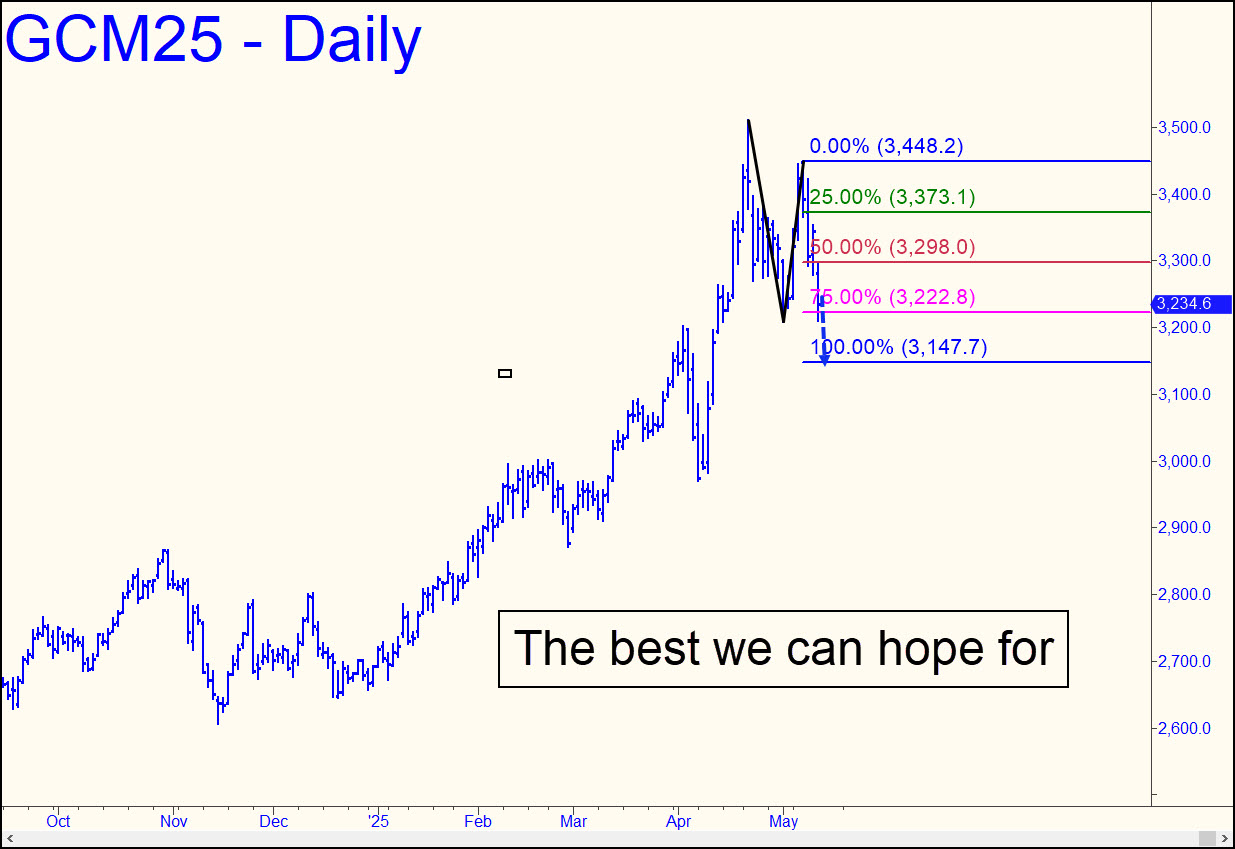
 June Gold looks headed to at least 3730.00, but that’s provided it can get past the 3533.90 Hidden Pivot I ballyhooed here for a while. (The target worked well, to put it mildly, getting within 0.6% of the actual so-far top at 3510.) If June Gold were to drop by $200 now, it would not necessarily be reason for concern; for in fact, 3135.90 would trigger a ‘mechanical’ buy, stop 2938.00. These numbers come from the monthly composite chart (see thumbnail inset), where A=1618 in November 2022. Best bet for tightly stopped bottom-fishing: 3261.50, the ‘d’ target of a pattern discernible on the hourly chart. _______ UPDATE (May 12, 3:08 p.m. EDT): The savage drubbing gold has received today reversed from such an obvious place that a relapse seems likely. The low for June Gold occurred at 3211.20, a hair above an important low recorded on May 1. Look for the selling to continue to at least 3147.70 before the futures find a decent foothold. (Note: The pattern on which this target is based is poorly formed, so I would not advise trying to bottom-fish there with the usual tight stop-loss.) Alternatively, a pop above 3352.70, however unlikely at the moment, would put bulls solidly back in charge. The selling feels more engineered than organic, and I doubt it threatens the long-term bull market. However, we’ll let the charts decide, since the downtrend would likely have farther to go if bearish ABCD patterns of varying time frames start to exceed their ‘D’ targets routinely
GCM25 – June Gold (Last:3235.20)
