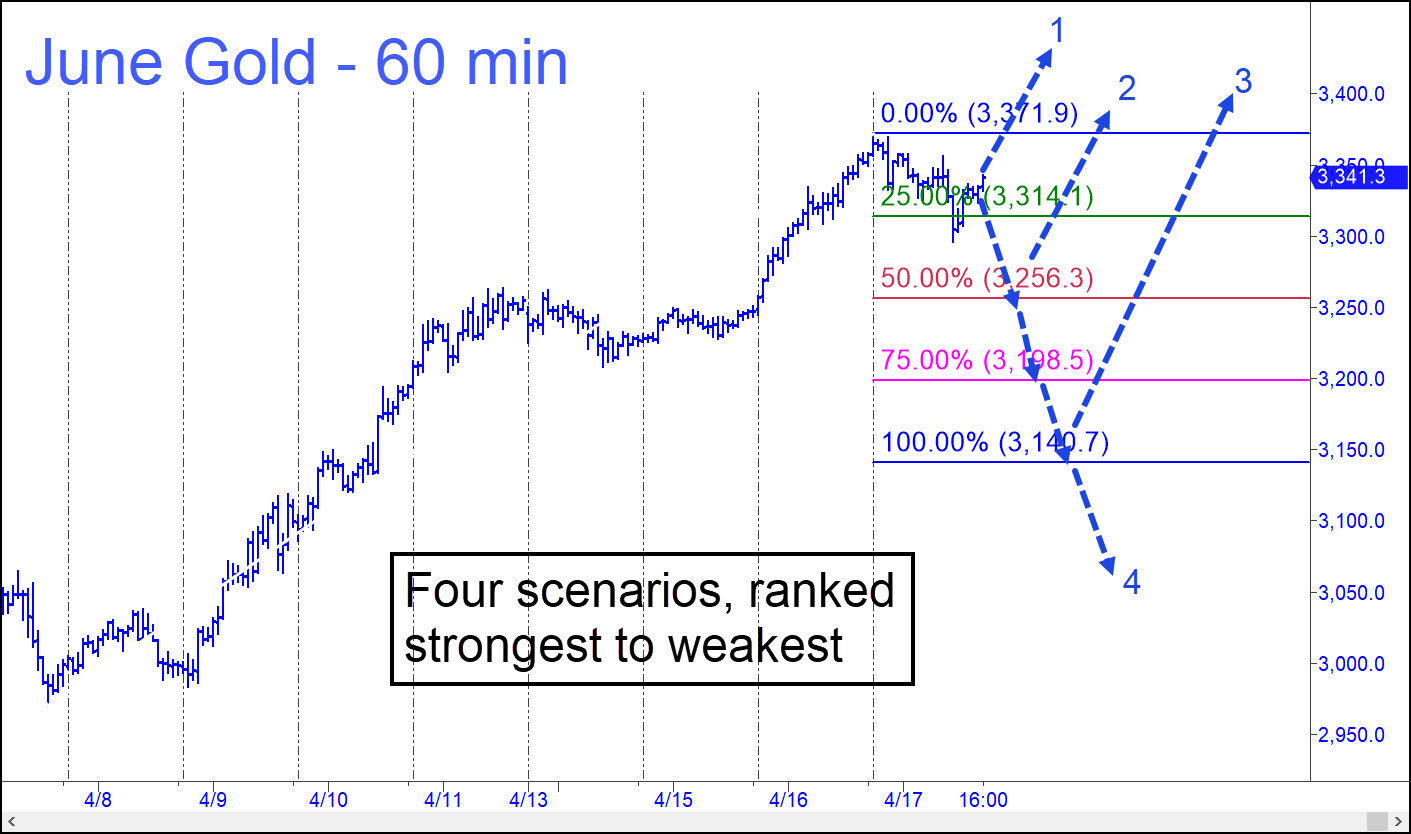
 You can use the chart to judge for yourself the strength of gold’s uptrend as it progresses. The move is extraordinarily powerful, to be sure, but that doesn’t mean the rally couldn’t reverse sharply at any time with no warning. We’ve been using a 3533.90 target for the last 600 or so points, but are the odds still compelling that gold will get there? Here’s how to read the chart so that you can determine this for yourself. It shows four possible scenarios, ranked from strongest to weakest. All began with Friday’s 57.80-point reversal off a record 3371.90. That triggered a theoretical sell signal at the green line (3314.10), the first such signal in two months. The implication is that the futures will now fall to at least 3256.30, the ‘midpoint Hidden Pivot (p), enabling at least a partial profit.
However, if the June contract doesn’t quite get there, and instead blasts off for new record highs, that would strongly imply 3533 will be reached, and quickly. A somewhat less bullish outcome (2) would be a strong bounce to new highs from the red line (p). That would follow the rule that powerful trends produce corrective ABCDs that do not reach their ‘D’ targets, but instead reverse from the midpoint pivot. Alternatively, if gold penetrates p the first time sellers make contact with it, that would increase the odds that D=3140.70 will be reached. And finally, if the downtrend were to crash ‘d’, that would raise the possibility that gold has made an important high at 3371.90 and is unlikely to reach 3533. I am enthusiastically recommending this do-it-yourself exercise to anyone who is interested in learning how the Hidden Pivot Method works and applying it to your own analysis. _______ UPDATE: (Apr 21, 9:21 a.m.): The blast-off scenario detailed above is unambiguously in motion this morning. This all but guarantees the rally will reach the longstanding 3533.90 target we’ve been using as a minimum upside projection since gold was trading below 2800. What then? A Hidden Pivot target above 3533.90 is harder to find, even with charts that go back to historical lows below $300, but my best guess — technically derived — is 3725.00. Consider it likely to be reached if bulls shred their way past 3533.90. I don’t consider this likely and expect 3533 to show some stopping power, but we still need to be prepared for more. As an abstraction, $5000 gold hardly seems unreasonable at this point. Whatever the case, it will always be my goal to provide very precise, technically derived targets rather than feel-good dartboard guesses. _______ UPDATE (Apr 25, 9:25 a.m.): The uptrend’s sudden reversal last night is bearish for the near-term. Expect the imminent breach of Wednesday’s 3278.70 low to send the futures down to at least 3204.80, or even to 3145.00, in search of traction. There is a midpoint Hidden Pivot at 3264.60 that ordinarily would be expected to generate a tradable bounce, but if it doesn’t, that would be an additional negative sign.