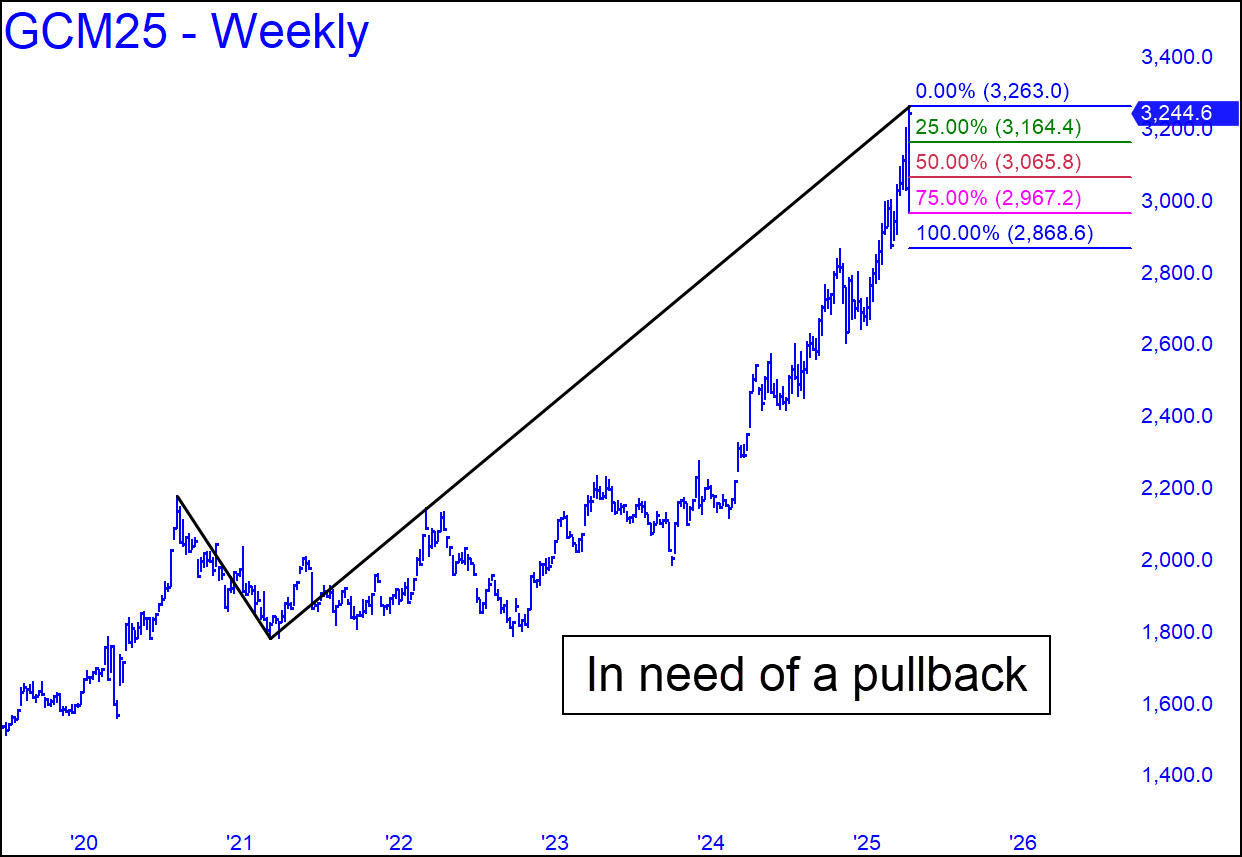
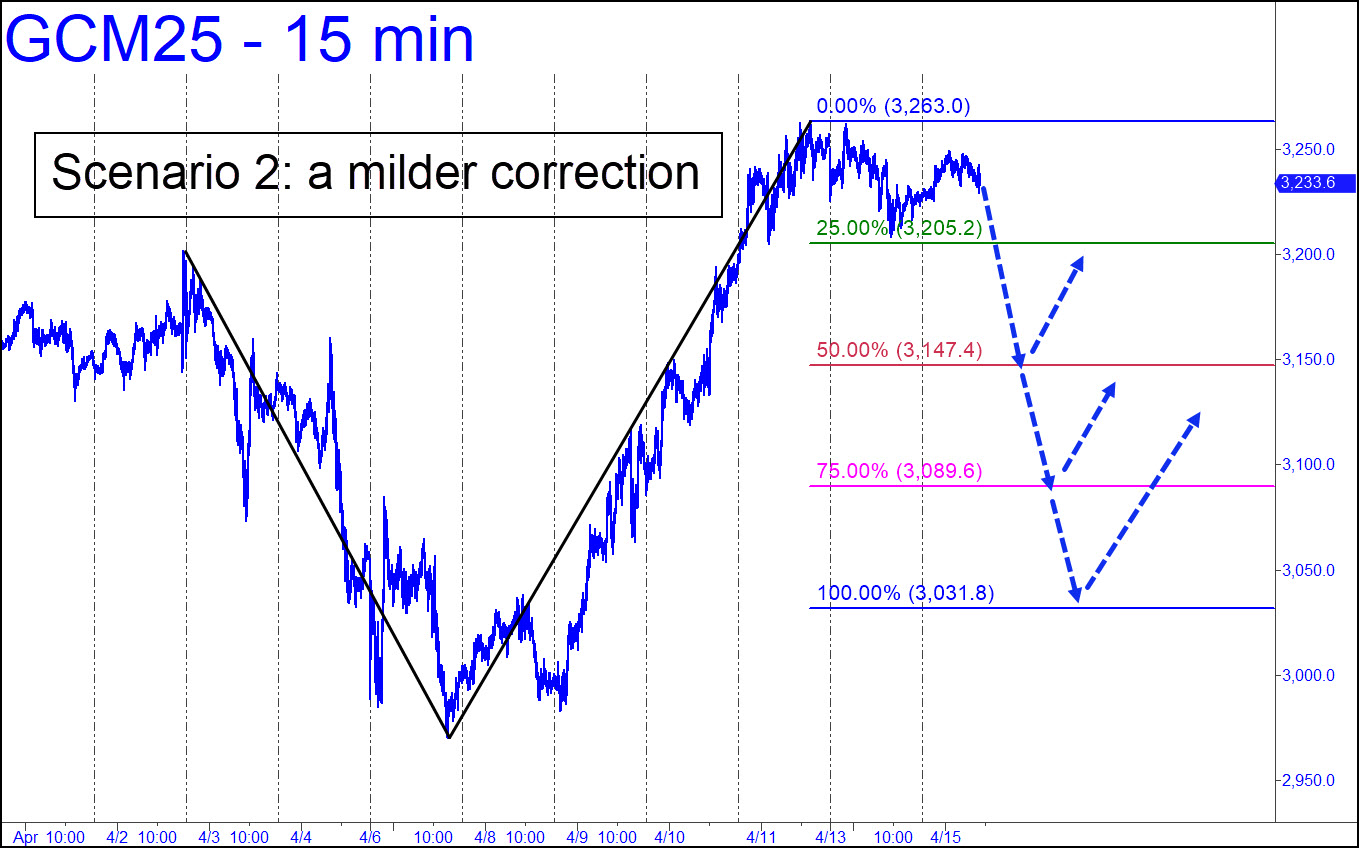
 I’ve drawn a cautionary pattern because gold is long overdue for a full abcd correction, and because Friday’s high occurred almost precisely at a 3261.40 target I’d posted in the chat room around 10:00 a.m. Assuming the high endures, the rABC pattern implies a pullback to the 2868.60 ‘d’ target is likely. (Note: You’ll need to shift ‘c’ upward if gold continues to rise.) The years-old ‘a-b’ segment remains viable because no pullback since this leg was completed in 2021 has reached ‘d’. If it does now, that would amount to a 12% correction. You can bottom-fish with a tight stop at p, but be aware that its decisive breach, wherever it occurs, would warn of more slippage to ‘d’ or lower. _______ UPDATE (Apr 14, 1:25 p.m.): The correction predicted for gold using the weekly chart (see ‘above) would be quite painful, but there is a milder scenario suggested by the hourly chart reproduced here. June Gold, playing coy, has not yet tripped a theoretical sell signal by touching the green line (x=3205.20), but if and when it does, it should be presumed bound for the midpoint Hidden Pivot support (p) at 3147.40. We’ll be better able to judge the strength of the downtrend after we’ve seen sellers interact with p. A decisive penetration on first contact would imply more weakness, as would a subsequent overshoot of d=3031.80. Both levels can be bottom-fished with a tight stop-loss. (Note: So much for weakness! The futures still haven’t tripped a sell signal, never mind sold off. The chart has been updated and slightly revised, since the original ‘c’ coordinate was slightly off.)
GCM25 – June Gold (Last:3238.60)
