 A 4820 target I’ve billboarded in SPX says lower prices are coming, but that shouldn’t discourage us from identifying countertrend opportunities as this vehicle works its way lower. The pattern shown is theoretically suited to that task, but it keeps signaling money-losing ‘buys’ at the green line. Let’s use it instead to tell us when a meaningful bounce might be under way. It will do so by popping above p decisively, but you’ll need to adjust p with each new ‘c’ low to use the pattern effectively. It will be worth the work because any textbook ‘mechanical’ buy signaled thereafter is very likely to make you money.
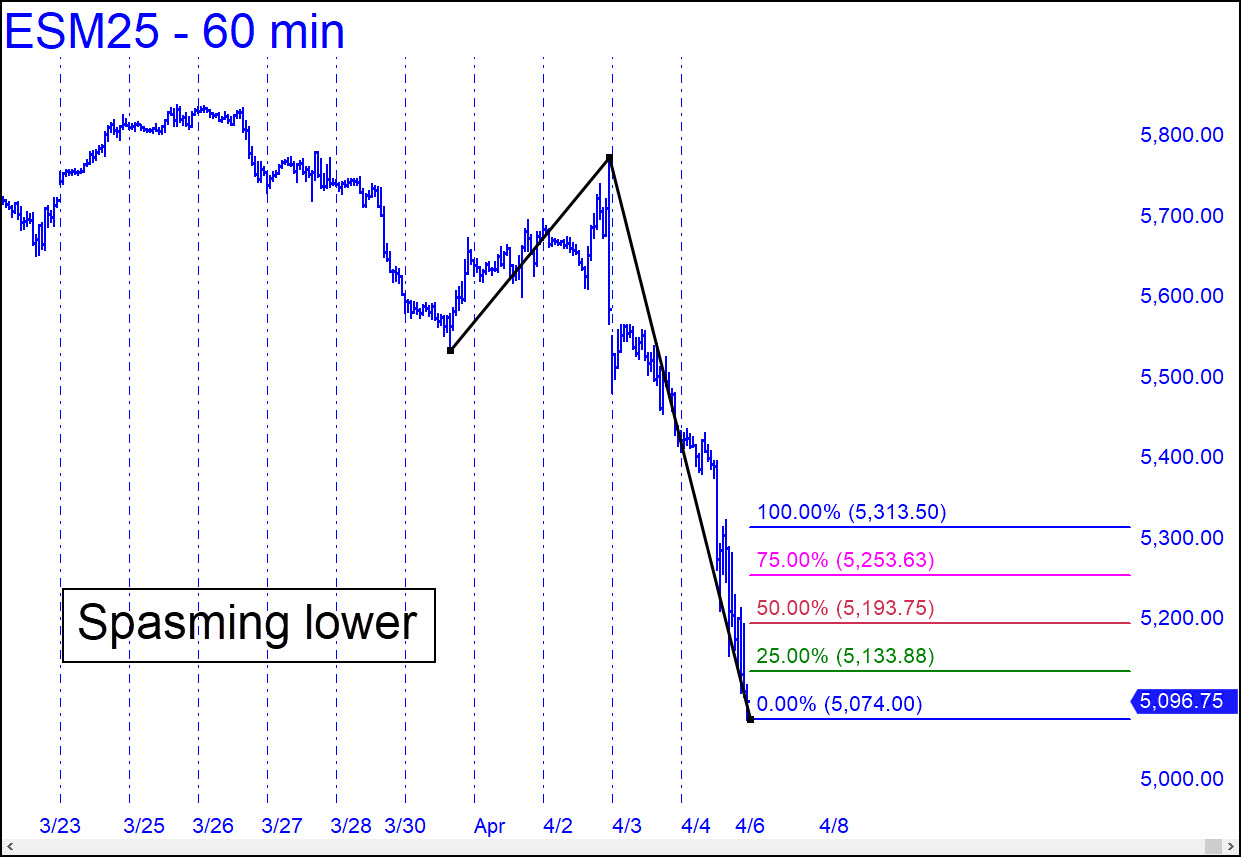
ESM25 – June E-Mini S&P (Last:5096.75)
