
 This week’s chart gives the S&PS room to make a somewhat higher high before their inevitable collapse. My recent forecasts have brimmed with confidence that the end is nigh, especially now that a multitrillion-dollar AI investment bubble must be unwound. Even so, the stakeholders are some of the biggest, most powerful financial entities in the world, so we shouldn’t doubt their ability to squeeze stocks higher against all reason and logic, the better to distribute as much horrifically overpriced stocks to the rubes as they can.
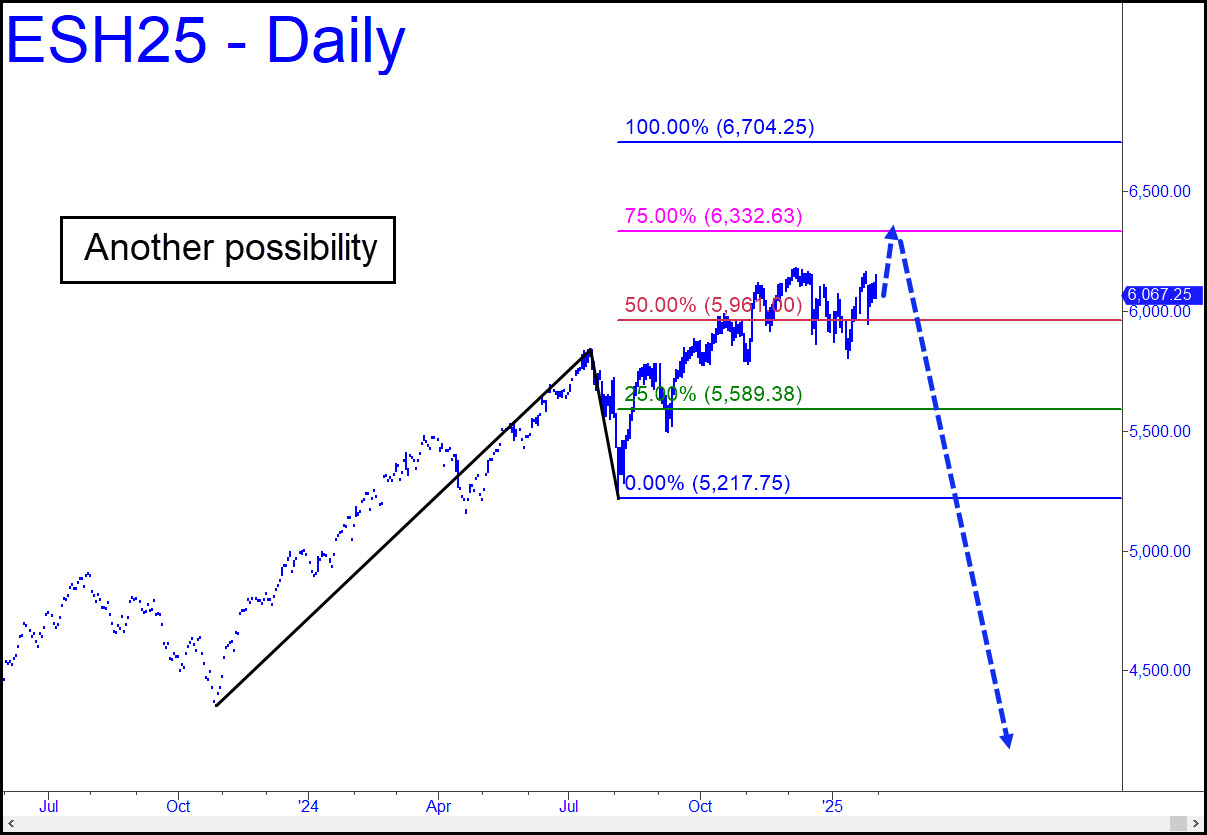
The chart shows a 6704 bull market target that lies 10% above. However, because of the balky, drawn-out move through p=5961 midpoint pivot, a follow-through to the target is hardly a done deal. That’s why I am forecasting that p2=6332 will mark The Top. It’s also possible the broad averages will make their final highs here, midway between p and p2, although that would be an unusual place for such a spectacular bull run to end. For now, though, we’ll trade with a mildly bullish bias until minor, uptrending ABCD patterns start falling short. The most immediate rally target of consequence lies at 6301, 234 points above. In the meantime, you can buy a pullback to 6036.25 ‘mechanically’ with a 5947 stop-loss. ________ UPDATE (Feb 3, 9:36 a.m. EST): The futures are unavoidably on their way down to exactly 5863.75, a Hidden Pivot obscure enough to work well for bottom-fishing. Your trading bias should be bearish at least until it gets there. Here’s the chart.