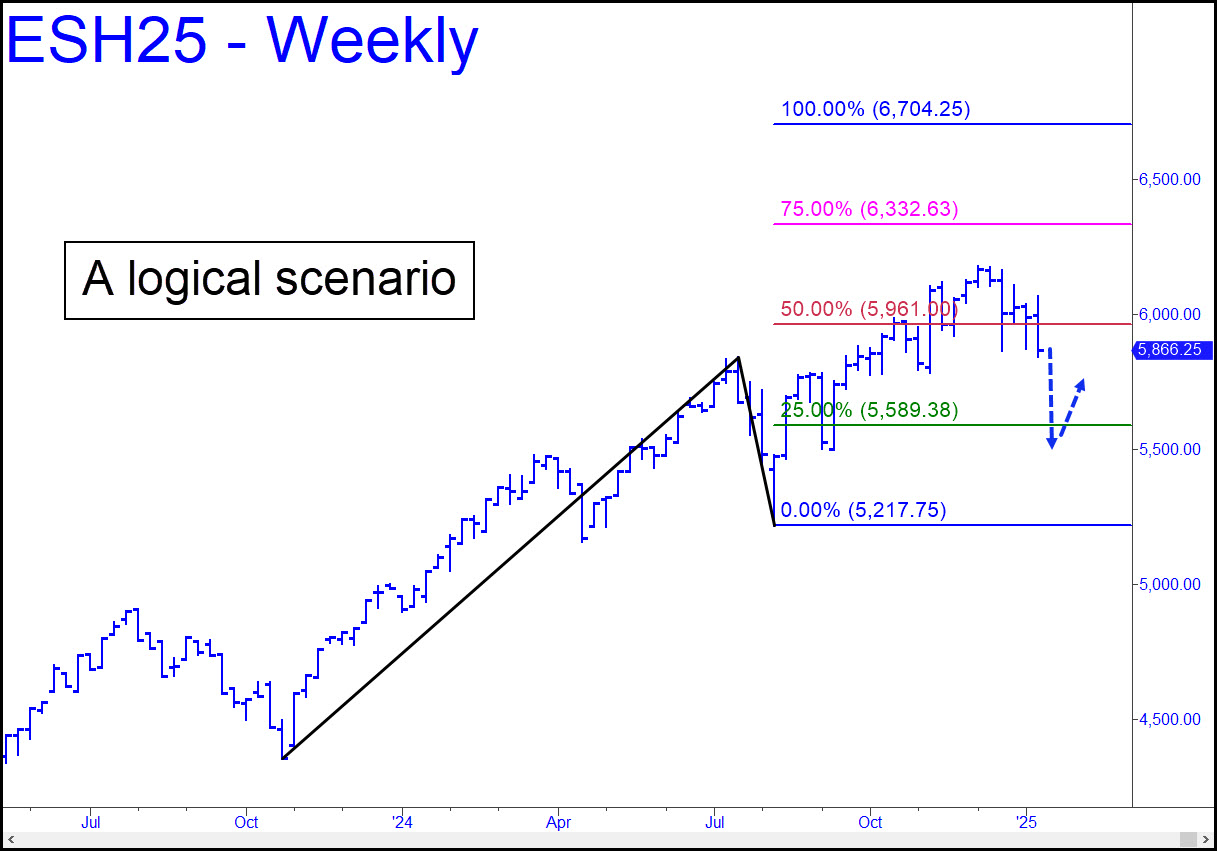
The chart shows a timely scenario with details that last week’s view lacked. The emphasis is not on the price at which the S&Ps appear to have topped, but on what the first stage of the bear market might look like. It is a single-month chart rather than a blended one, and it shows the March contract falling to at least the green line (x=5589.38) on an initial drop. This would create a ‘mechanical’ buying opportunity, although we would surely attempt it only with a trigger pattern of small degree (aka ‘camouflage’). I’ve promised you that we have little to fear from violent swings, since the Hidden Pivot Method excels at predicting their tops and bottoms; or even if failing at that, to allow us to trade extreme volatility without risking our shirts. I don’t expect the week to start with a rally, but if DaBoyz pull out all the stops to distribute this hoax in the opening hour, don’t pass up the opportunity to get short at 5990.38 with a tightly crafted rABC trigger.
ESH25 – March E-Mini S&Ps (Last:5866.25)