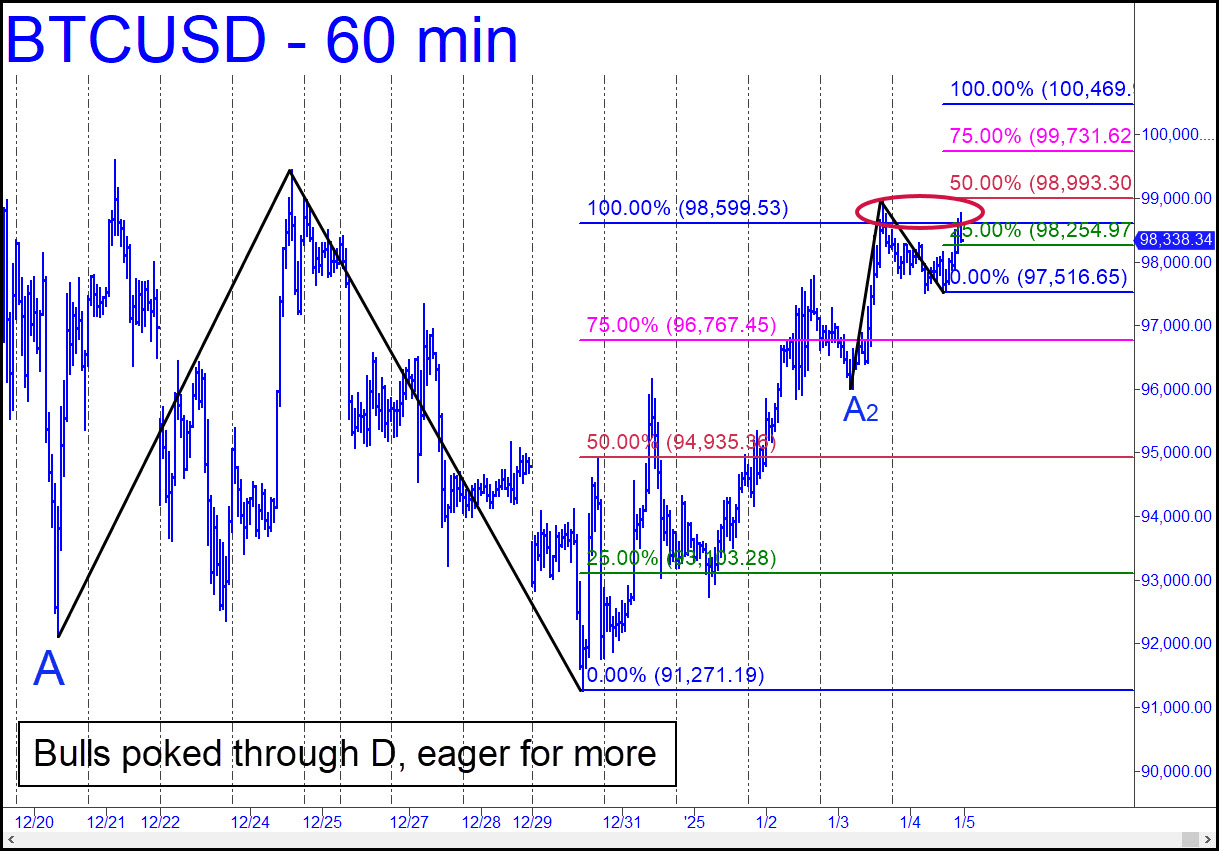
Bitcoin’s low on December 29 got nowhere near the 89,246 Hidden Pivot support where I’d suggested bottom-fishing. The actual low occurred at 91,271, nearly $2000 above our implied bid, setting the stage for a recovery rally that looks likely to continue to at least 100,469. The small pattern associated with that target is shown at the tail end of the larger reverse pattern targeted on 98,599. It got poked and prodded, then slightly exceeded once more on Saturday, suggesting bulls are raring to go. The 98,993 midpoint Hidden Pivot of the small pattern should produce a fleeting pullback suitable for scalping, but expect it to be shoved aside ahead of a push to 100,469. (Please note that I’ve switched to a new symbol that, unlike BRTI, is tradable. It is listed on the Coinbase Exchange, GDAX.) _______ UPDATE (Jan 6, 12:31 p.m. EST): Here’s a chart you can use to tame this idiot-driven little sonofabitch. This morning’s impalement of the red line (p=99,437) implies bitcoin will reach the 107,604 ‘d’ target. Any one-level pullback can be bought ‘mechanically’ using a stop-loss equal to a third of what you stand to make if BTCUSD achieves d=107,604. I suggest paper-trading this one unless you know the rules for ‘mechanical’ trades and the location of the ‘sweet spot’.
BTCUSD – Bitcoin (Last:101,926)