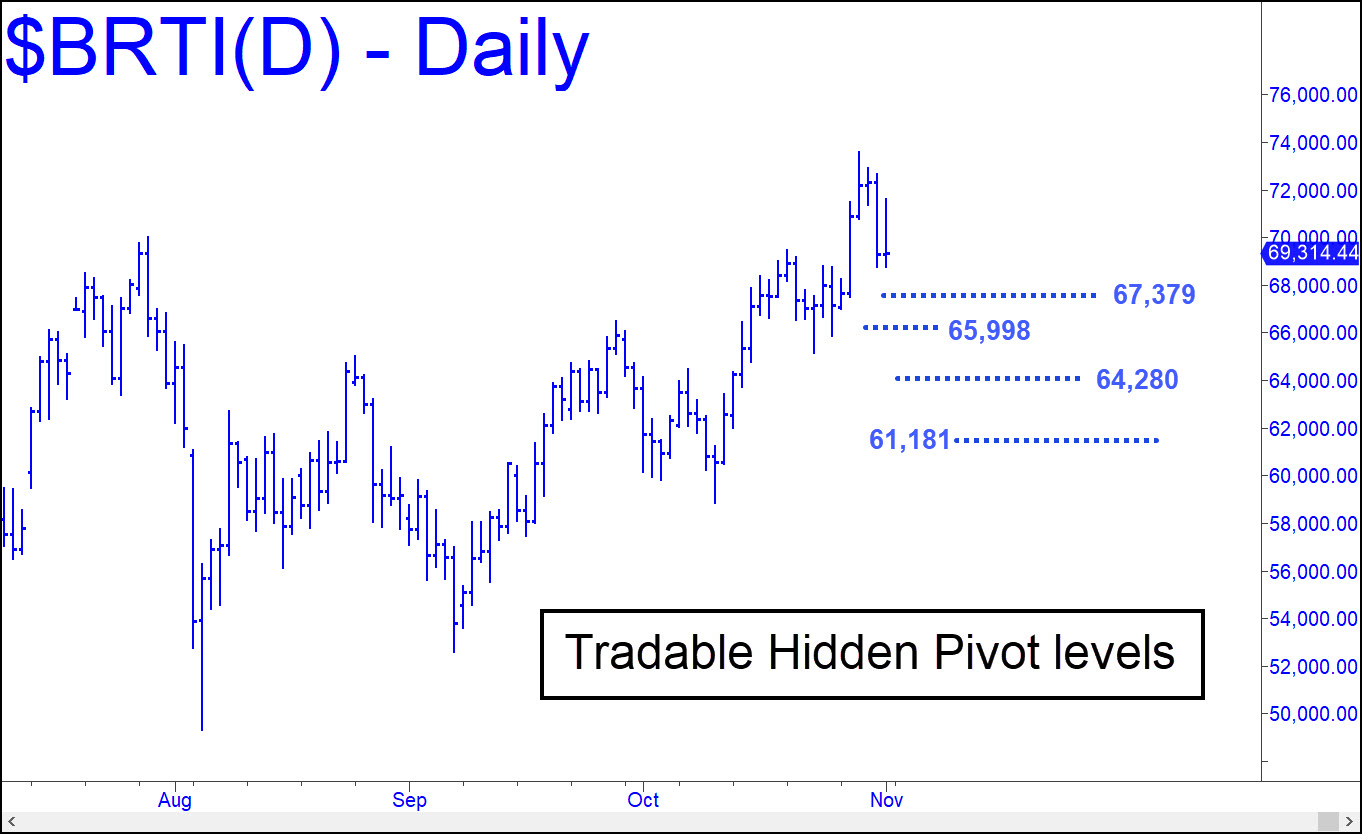
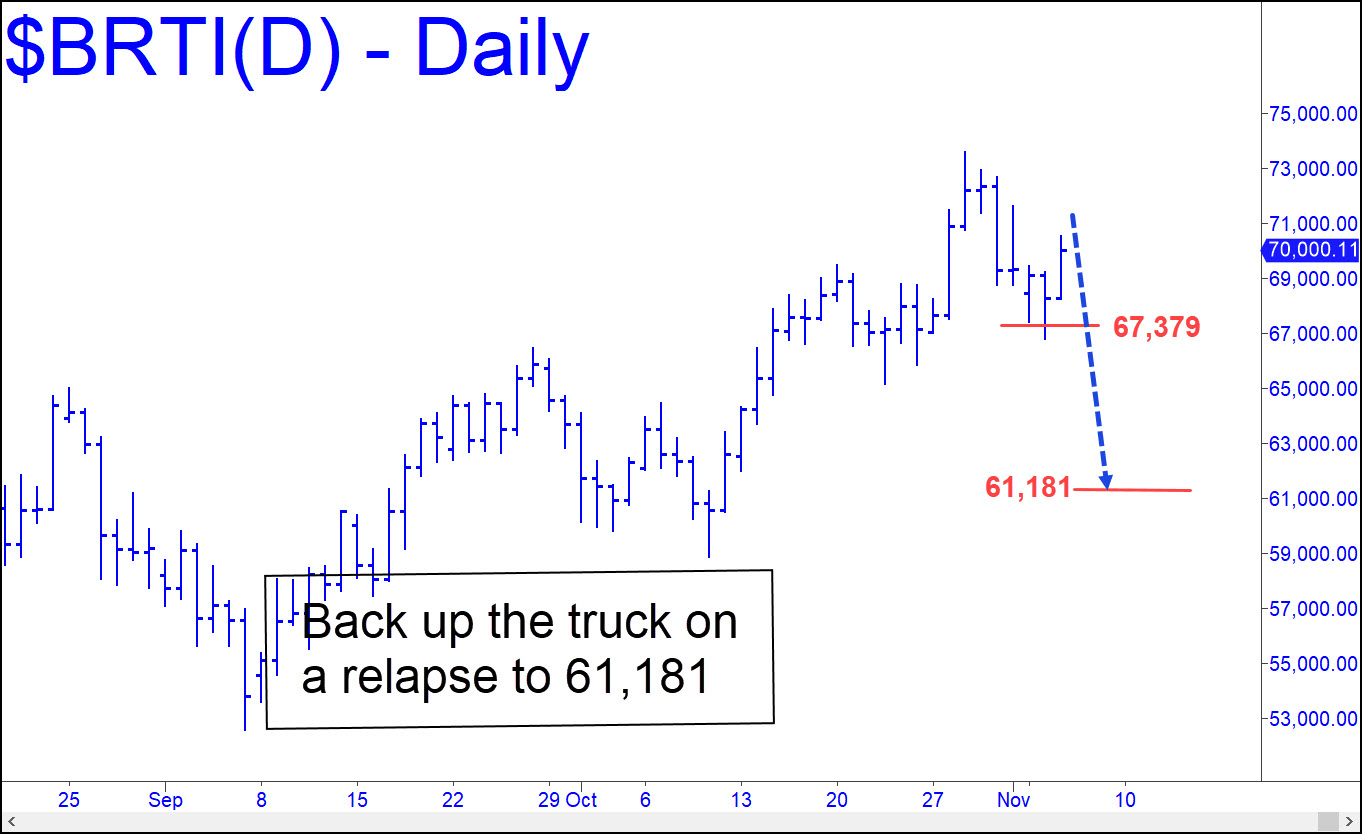
 The chart shows four Hidden Pivot levels that could yield cautious entry set-ups for traders who shun risk and especially fear high-volatility monsters like this one. We typically trade such levels using ‘reverse-pattern’ triggers that are discernible on the lesser intraday charts. This tactic is proprietary, but you can seek guidance in the Rick’s Picks trading room, a hangout for some of the best day traders you will find online. Please note that if one of the levels shown is decisively (i.e., by more than 0.5%) penetrated on first contact, the next will automatically become the minimum downside target. The lowermost of the targets shown is 61,181, a Hidden Pivot that you should treat as a back-up-the-truck number likely to produce a precise, and therefore easily tradable, low. _______ UPDATE (November 5, 2:36 p.m.): A bullish bet at 67,379, the first place I’d suggested looking for an upturn in the post below, would have produced a gain so far of $3,146. That is based on a so-far high of 70.525 for the move. The low at 66,803 was less than 1% beneath the ‘hidden’ support of the line I drew on the chart accompanying the earlier post. My hunch is that bitcoin will relapse to get a running start on the record 73,578 high recorded on October 29. If so, a tightly stopped bid at 64,280 can be attempted. However, 61,181 is still a back-up-the-truck place to get long ahead of a presumptive record-breaking run-up in the unlikely even Bertie pulls back sharply. Please note that the BRTI symbol is a real-time proxy for bitcoin that reflects the best bids and offers across many crypto markets at a given instant. For trading purposes, you can interpolate my targets, support and resistance levels.
BRTI – CME Bitcoin Index (Last:69,948)