
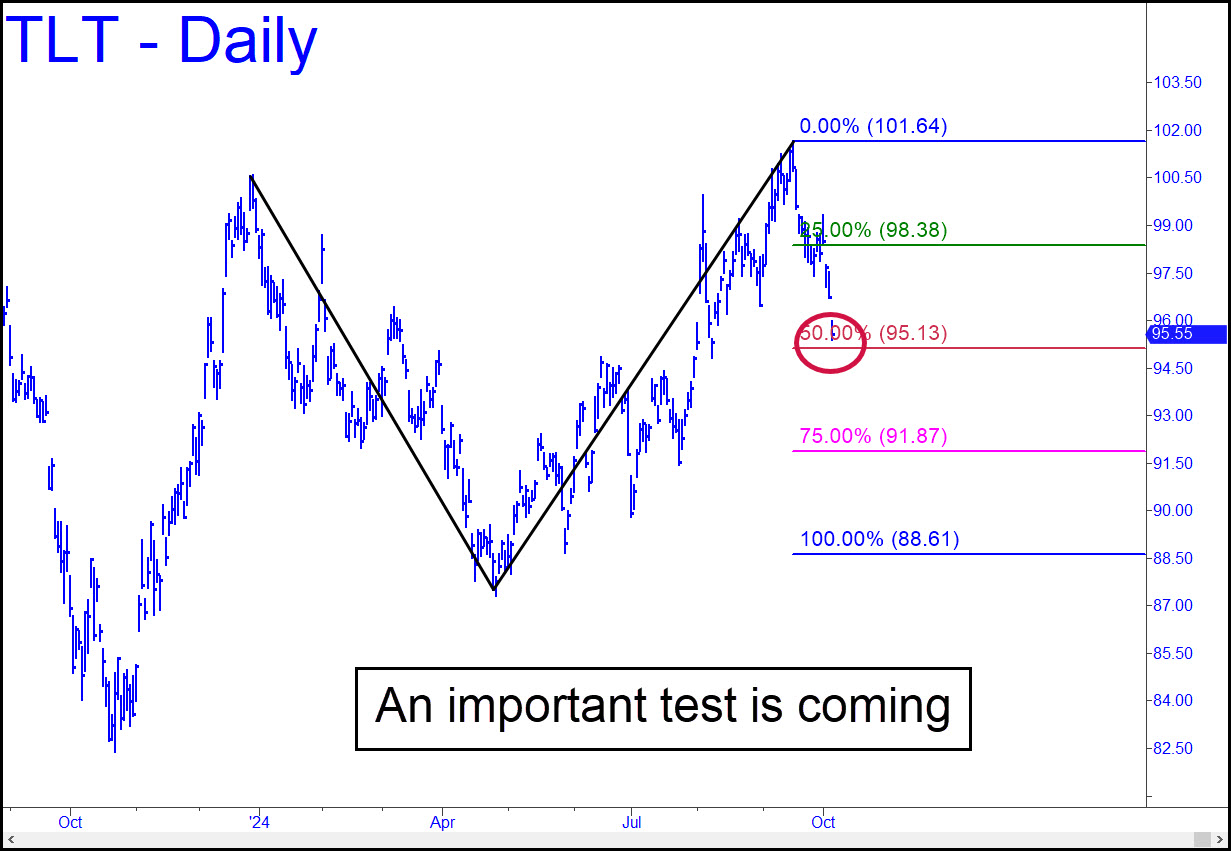
 Friday’s plunge brought TLT down to within a hair of a compelling Hidden Pivot support at 95.13, but also to a voodoo number conducive to tightly stopped bottom-fishing. It remains to be seen whether this presumptive correction splatters the midpoint support, passes through it with ease, or reverses direction. Two consecutive daily closes beneath it would imply more slippage to at least 91.87, the pattern’s ‘secondary’ support. Still worse would be a decisive penetration the first time it is touched, since that would open a path down to d=88.61. All of this would be occurring in a balky bull market that could see TLT climb to 105.49, a big-picture target identified here previously.
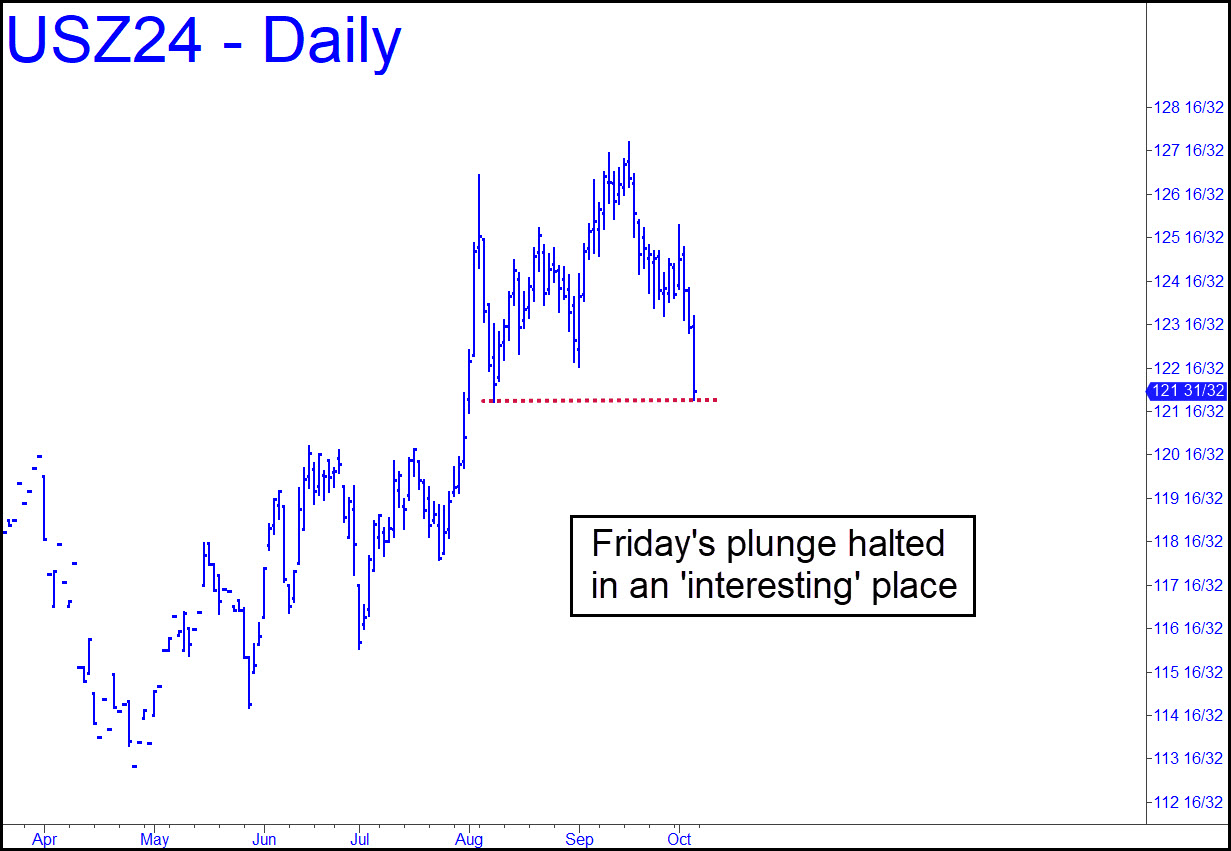
It shouldn’t surprise anyone that Treasury debt has been getting pounded. The Fed recently began to ease with stocks and real estate in a vertical climb and the job market, such as it is, showing no sign of weakness. This could not but lead to more inflation, even though I still expect it to be snuffed by recession and the far more powerful debt deflation that a return to hard times will bring. Finally, I’ll mention that T-Bond futures are in a similarly precarious position, having plunged on Friday to within two ticks of an important prior low at 121^23 recorded on August 8. If the December CBOT contract should breach the low, that would create a strong impulse leg of daily-chart degree. This implies that any subsequent rally would be corrective rather than destined for new highs. Here’s the chart.