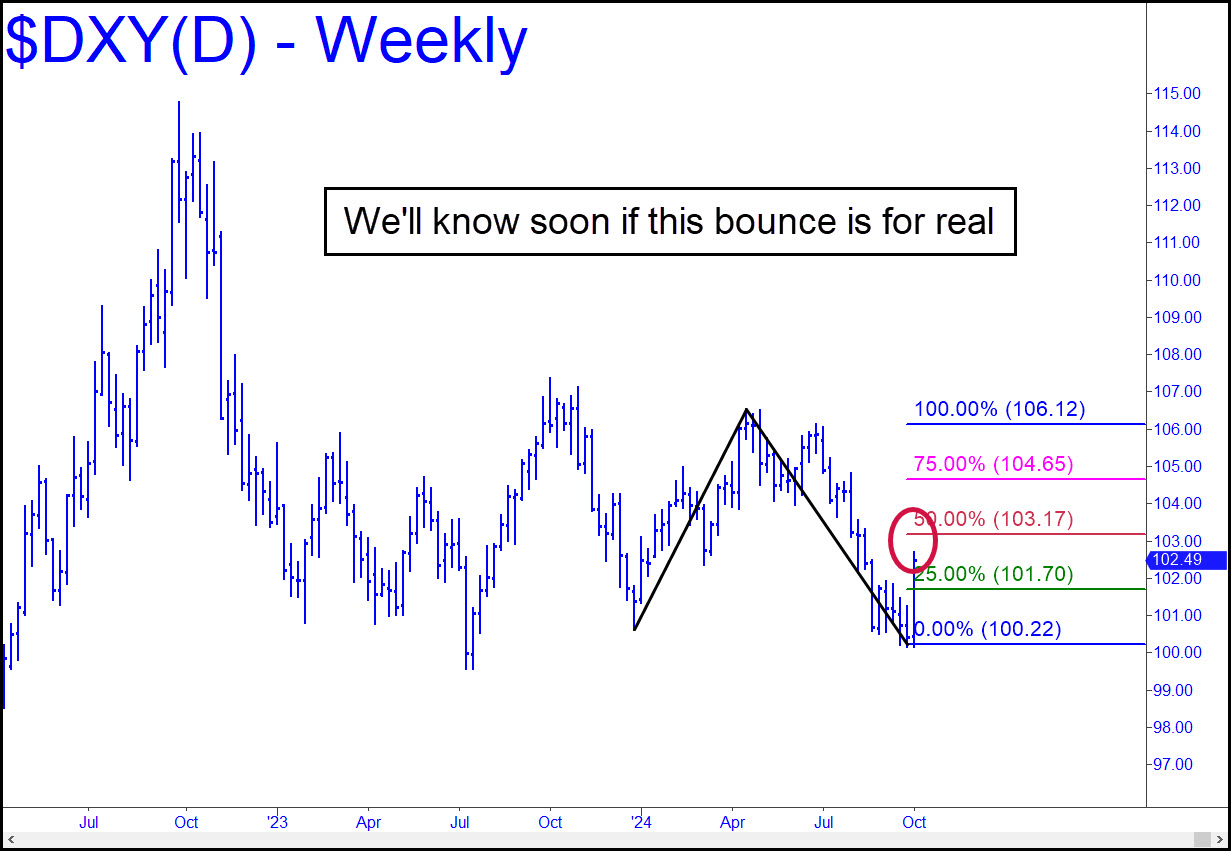
Last week’s bounce was the most powerful in a year, but is it going anywhere? We could know soon, and with a high degree of confidence, depending on how the uptrend interacts with the 103.17 midpoint resistance shown in the inset. Although an easy move past it would imply more upside to at least D=106.12, that would leave the dollar merely level with a supply zone created by several peaks extending back nearly two years. A breakout above 107 would turn the weekly chart strongly impulsive, but we’ll wait till it happens before drawing any conclusions. Here’s a bigger picture to remind you that the almighty buck has been in a bull market for more than a decade, notwithstanding the Fed’s best efforts to turn it into confetti. It is the only currency big enough to handle the global financial shell game, and it will always be in high demand for that reason, no matter what the BRICs and our many enemies are plotting against it. The chart shows upside potential to at least p=112.20 on the next breakout. ______ UPDATE (October 13): The rally stalled last week a tick above the 103.17 resistance noted above. Bulls need to do better to demonstrate their ability to push the Dollar Index up to at least 106.12.
DXY – NYBOT Dollar Index (Last:102.49)