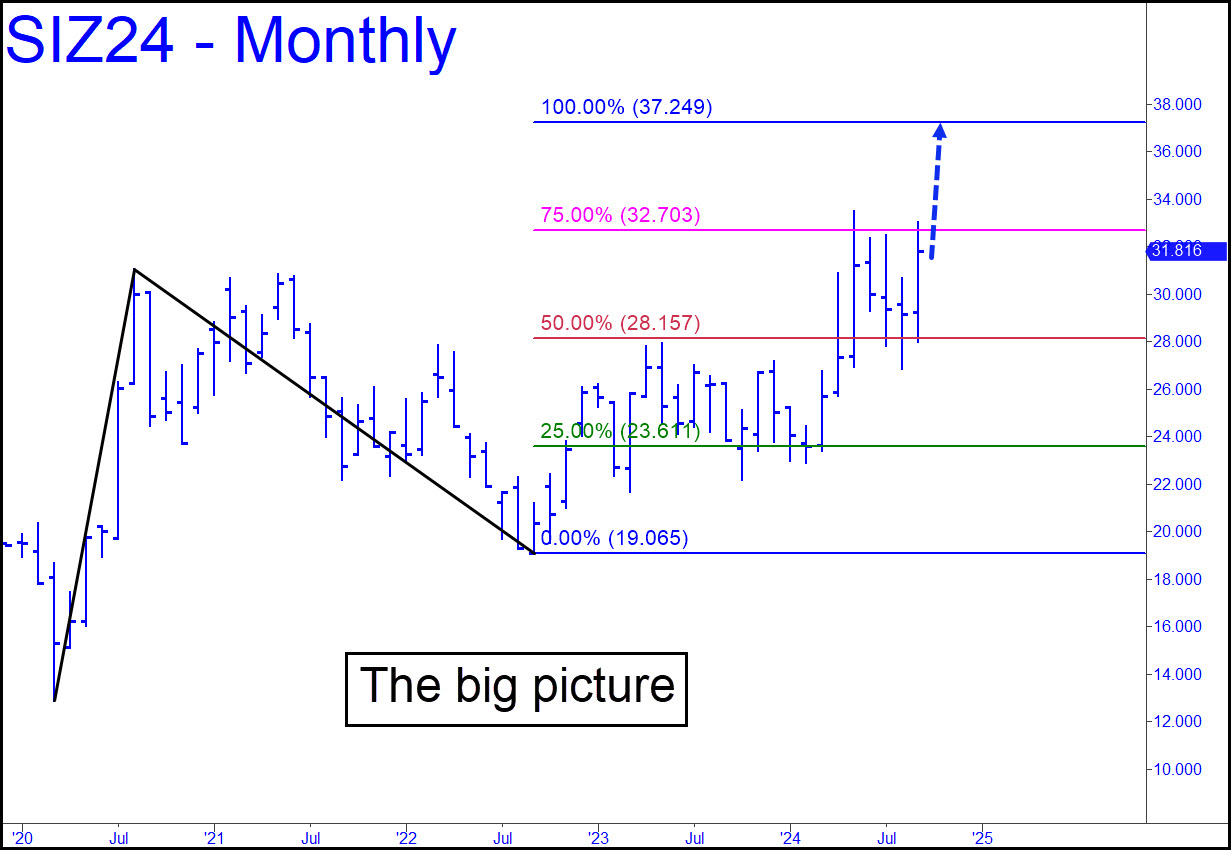
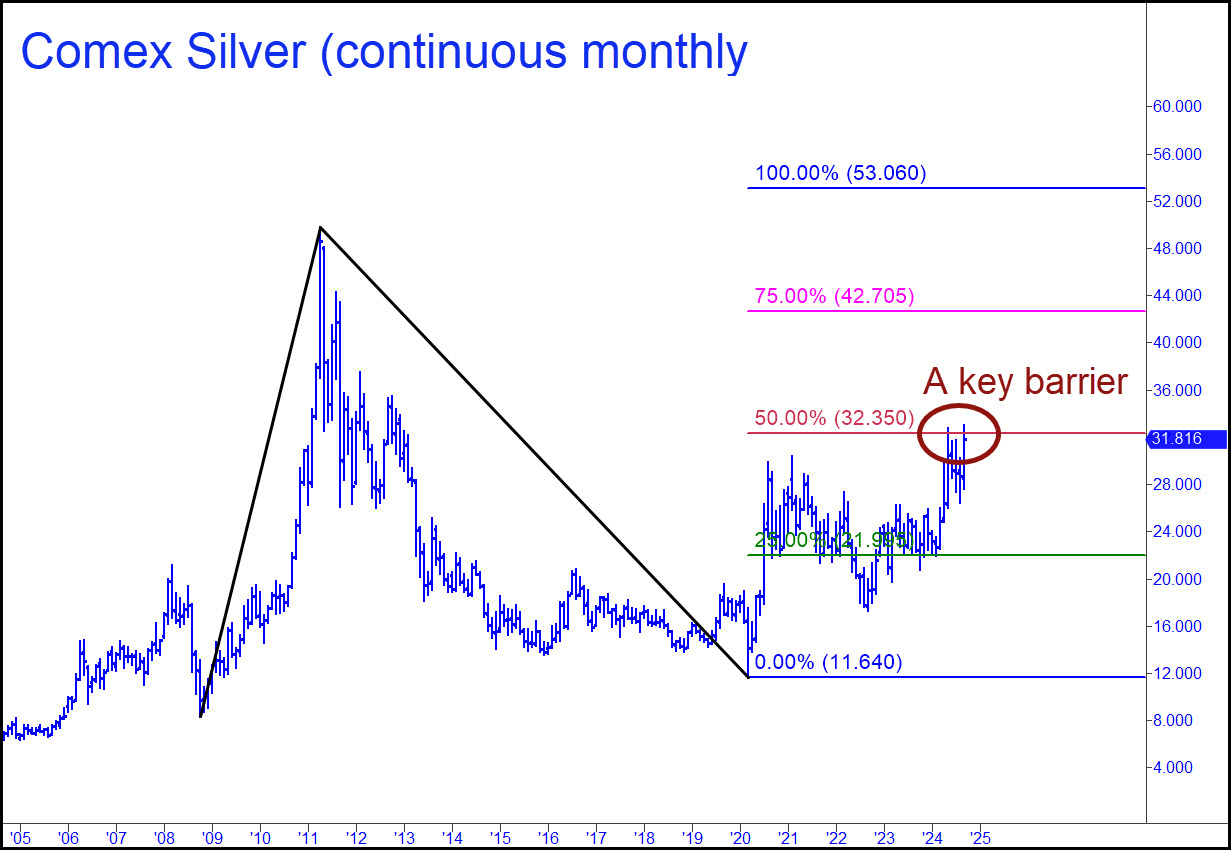
 This week’s charts take a step back to show a big picture, and an even bigger one. There is most immediately a 37.249 target that traces back to the bull cycle begun in March 2020. That’s when covid madness struck and mutated unexpectedly into bullish hysteria on Wall Street. The provenance of that target is shown in the thumbnail inset. An even bigger picture that began with 8.40 silver in 2008 suggests that the bull market will top out at 53.060. Here’s a chart that shows this. You can see that bulls are stalled at the 32.35 midpoint Hidden Pivot resistance. Conquering this barrier will require two consecutive monthly closes above it or a decisive thrust to at least 35. A surge of mania could accomplish this within the next couple of months, but my gut feeling is that it will take significantly longer than that to consolidate silver for a push above 50. There can be no guarantees, however, since all price action since May has occurred off a top that failed to exceed any prior peaks. That means the larger bull phase that tacked on $2.82 since September 2022 is not impulsive. Even so, the power of the A-B leg, which took silver from 8.40 to 49.82 in three-and-a-half years, should suffice to overcome the relative timidity of the C-D leg. We should continue to trade this vehicle with an aggressively bullish bias while remaining alert to the possibility of nasty swoons of as much as $7 that institutional carry traders use to keep their short positions from blowing up and forcing delivery.
SIZ24 – December Silver (Last:31.816)