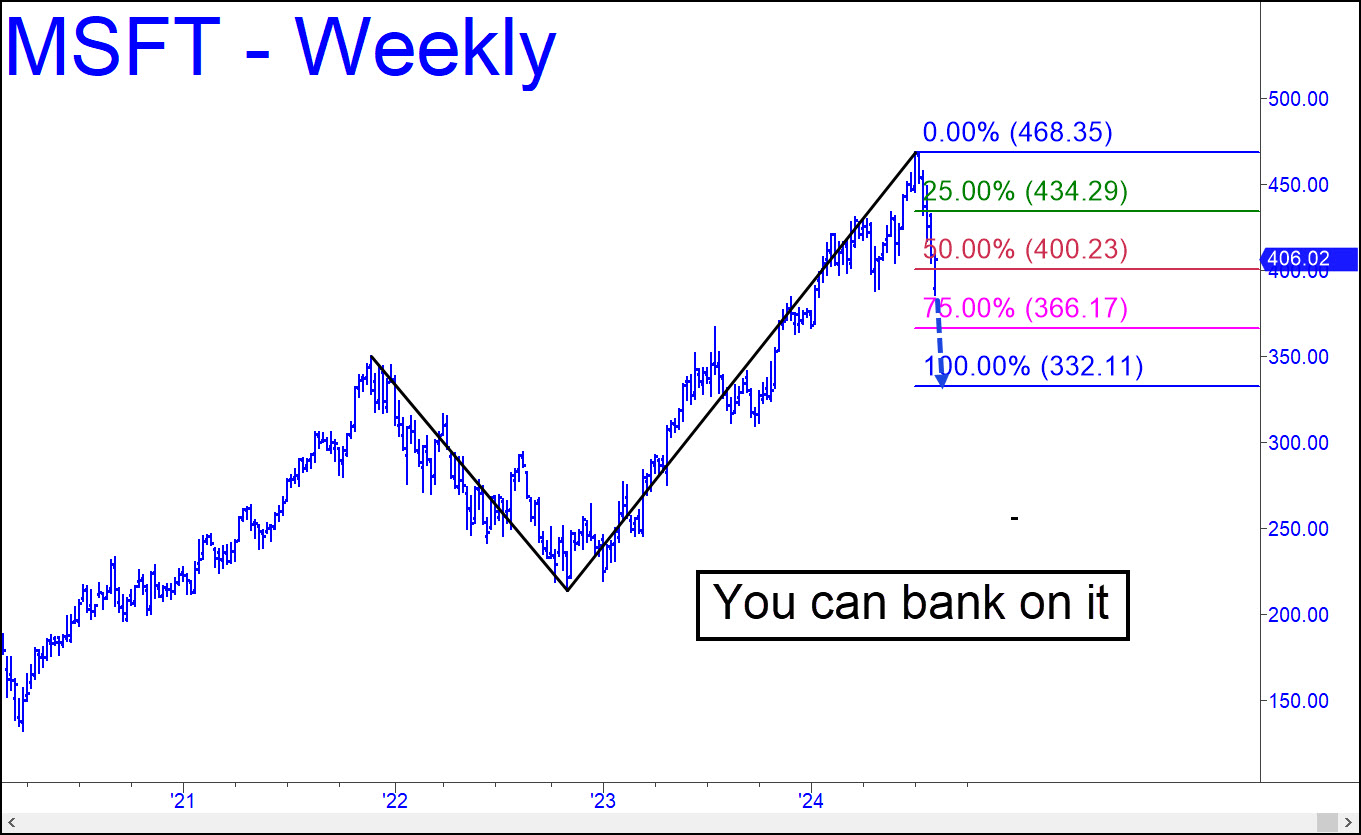
 The weekly chart shows our #1 bellwether stock to be reliably headed down to at least 332.11, the ‘d’ target of a perfectly clear reverse pattern. That would represent a 29% fall from the record 468 achieved in mid-July and 18% below Friday’s close. In the meantime, because last week’s low occurred almost exactly midway between p and p2, a rally to the green line (x=434.29) would trigger a succulent ‘mechanical’ short. Keep in mind that that is not a rally target, only a reference point we use to do this type of trade. Another place where you could attempt to get short is at 417.36, the midpoint Hidden Pivot resistance, on the hourly chart, of a=404.51 (5/31). The pivot should be used as a minimum correction target for the time being. _______ UPDATE (Aug 16, 3:30 a.m.): The uptrend has easily and decisively exceeded p=417.36 with a short-squeeze waft that has put the stock on-track for a shot at D=449.13 over the near term.
MSFT – Microsoft (Last:421.11)
