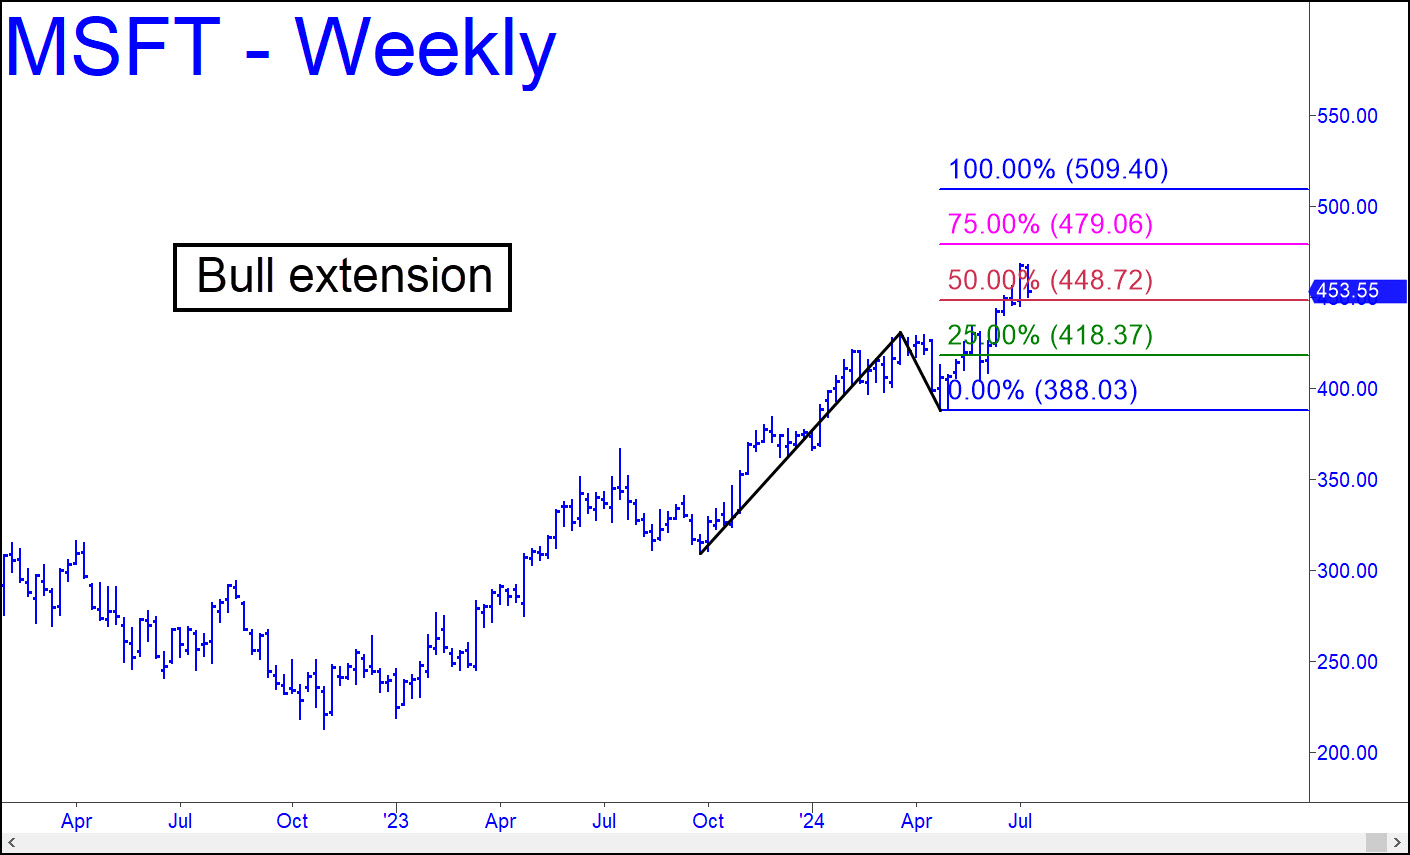
 I’ve used the ‘extension’ of a larger pattern’s C-D- leg to produce a chart that will be more usable for trading purposes. It is similar to the one accompanying the E-Mini S&P tout above, and it also offers similarly enticing odds for a ‘mechanical’ bid placed at the green line (x=418.37). The theoretical stop-loss would be at 388.02, implying the trade should be initiated using a ‘camouflage’ set-up on a small-degree, intraday chart. There can be no certitude that the stock will reach D=509.40, since the move through p=448.72 was not dramatic. You can count on a ride to at least 479.06, however, no matter where you get long.
MSFT – Microsoft (Last:453.55)
