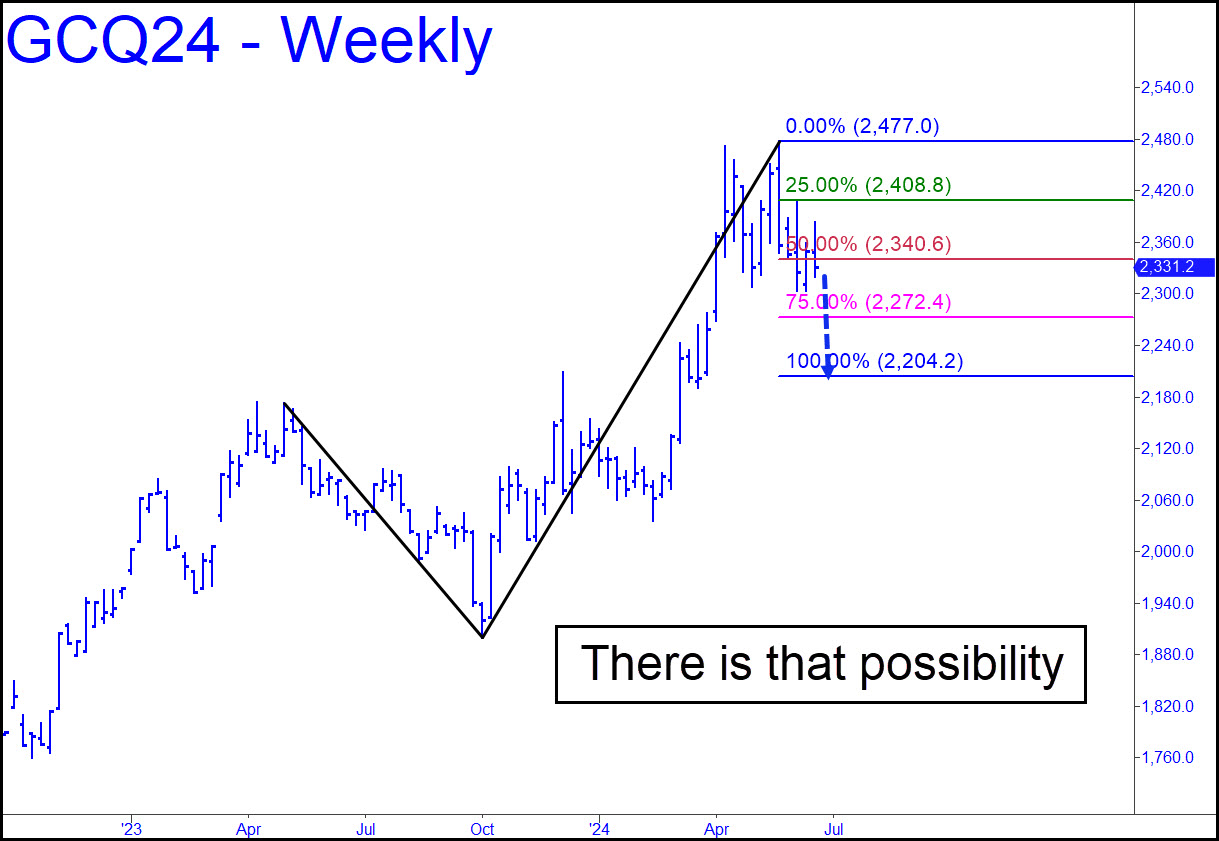
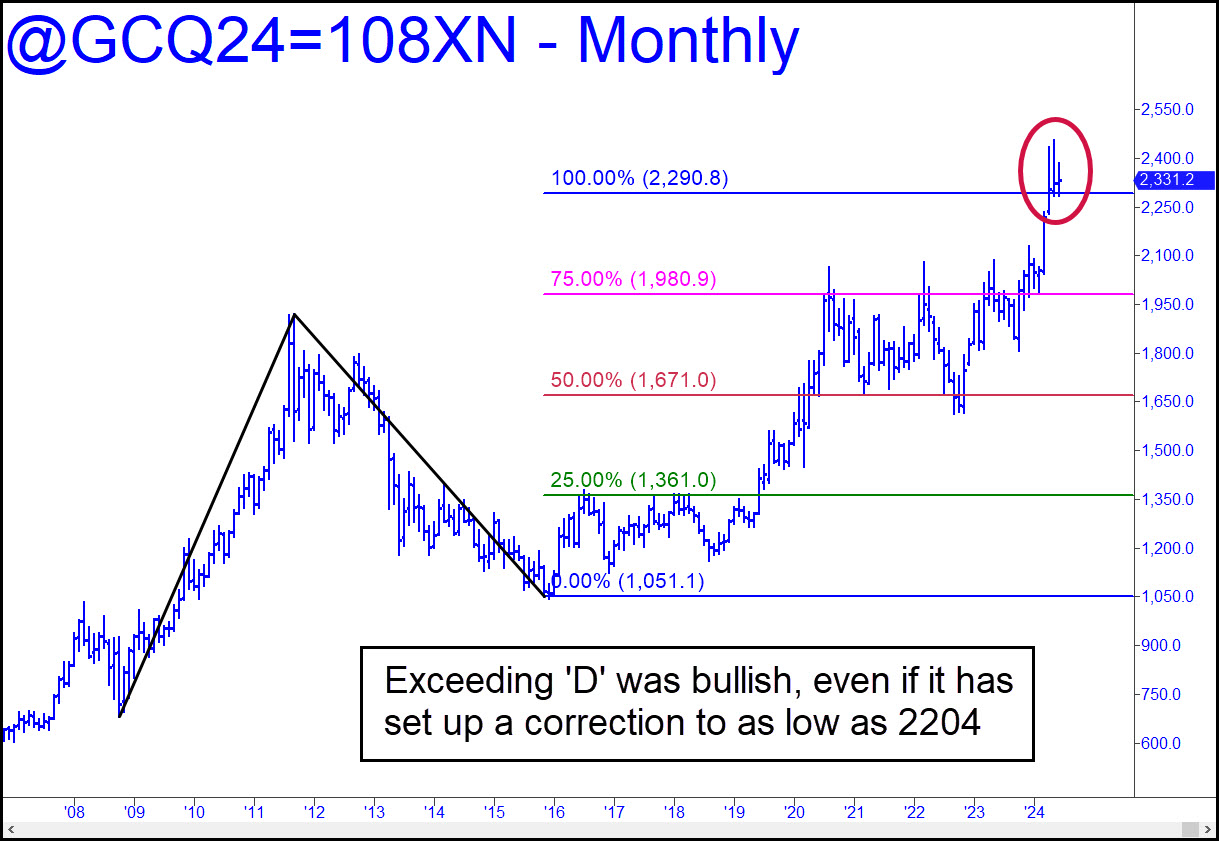
 There was hubris in my assertion last week that the perfectly formed head-and-shoulders pattern that has been taking shape since April would mutate into a ‘surprise’ breakout to the upside. However, the chart shows what to expect if this forecast proves to be flat-out wrong. There is that possibility. The August futures would fall to 2204.20, completing the H&S pattern, before they could find traction. Moreover, the Auggies would become a juicy ‘mechanical’ short if they rally over the next week or two to the green line (x=2408.80). The pattern is quite gnarly because of the double top, but I’ve seen this set-up work perfectly in the metals before (do NOT tell your friends if you plan to bottom-fish there, as you should). Rest assured, however, that even a $200+ dive as described would not mar the otherwise bullish look of the long-term charts. If you’re still worried, here’s a continuous monthly chart that shows the ostensibly distributive head of the H&S to be occurring above the ‘D’ target of a completed pattern stretching back 15 years. That is inarguably bullish no matter how nasty this correction gets.
GCQ24 – August Gold (Last:2331.20)
