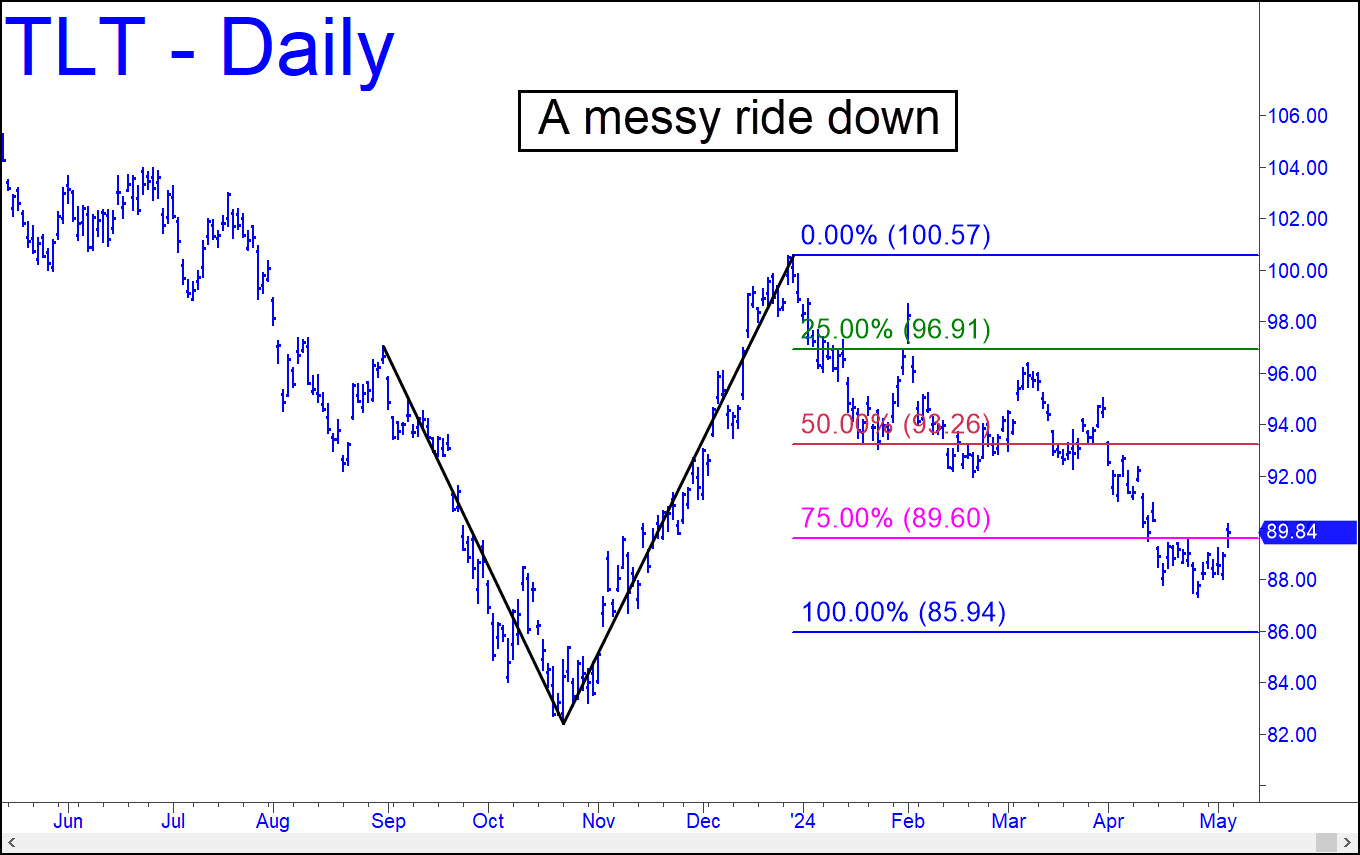
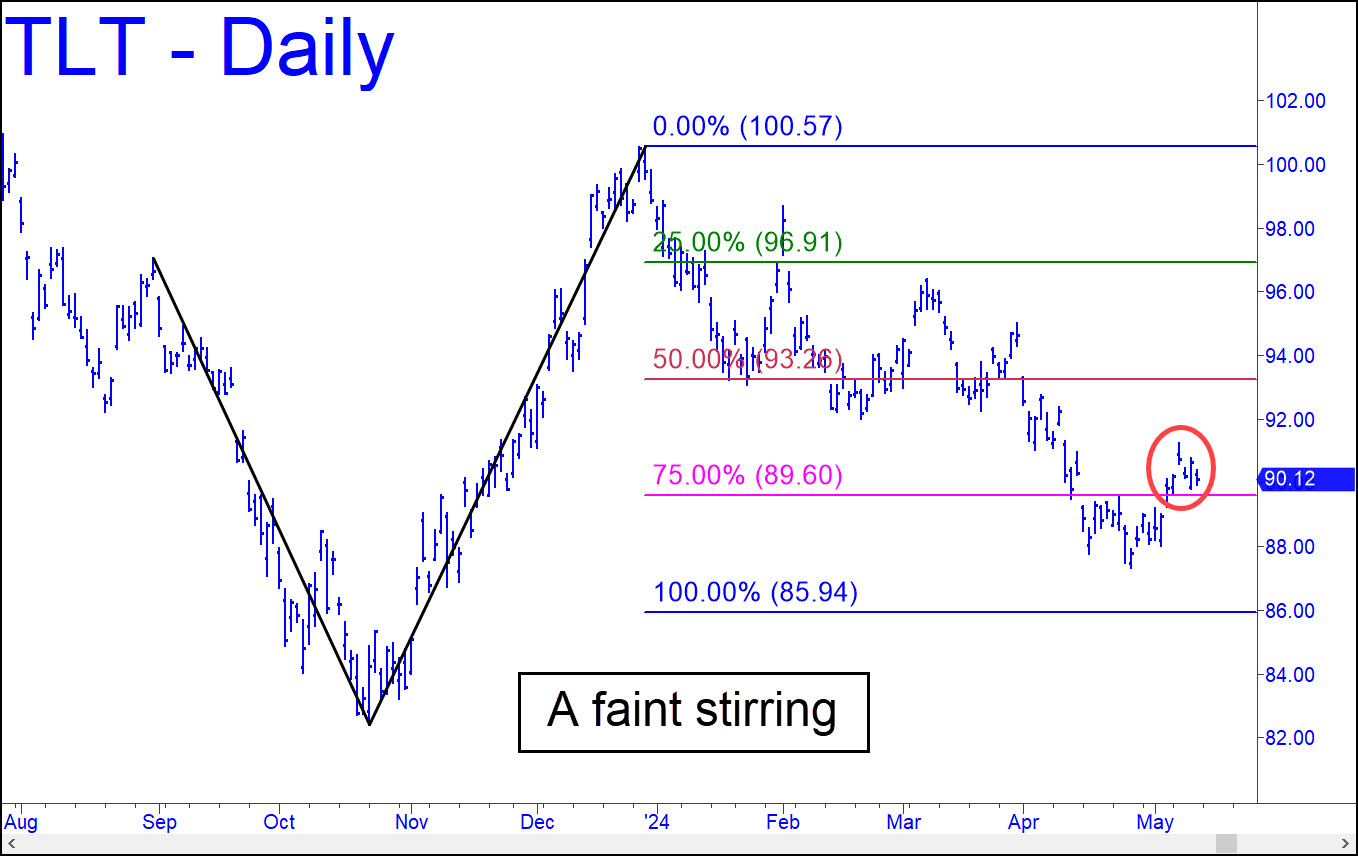
 TLT’s tortuous descent has depleted whatever energy may have been imparted to the trend by last autumn’s impulse leg. Under the circumstances, we shouldn’t count too heavily on the downside target at 85.94 to provide a precise turning point for bottom-fishing. We can still do the trade with a camouflage trigger that will risk only small change, but let’s also allow for the possibility that this erstwhile cinder block has finally carved out a bottom. Odds of this would shorten if the still youthful rally surpasses April 12’s 90.95 peak without a pullback on the daily chart. _______ UPDATE (May 10): Bulls showed a little life last week when they popped above an ‘external’ peak at 90.95 from April 12. This created an impulse leg of daily-chart degree, shortening the odds that an important bottom is in. Now let’s see if buyers can complete the small ABCD pattern shown to its D target, or even exceed it. That would be the most bullish sign we’ve seen in this vehicle since last autumn.
TLT – Lehman Bond ETF (Last:90.12)
