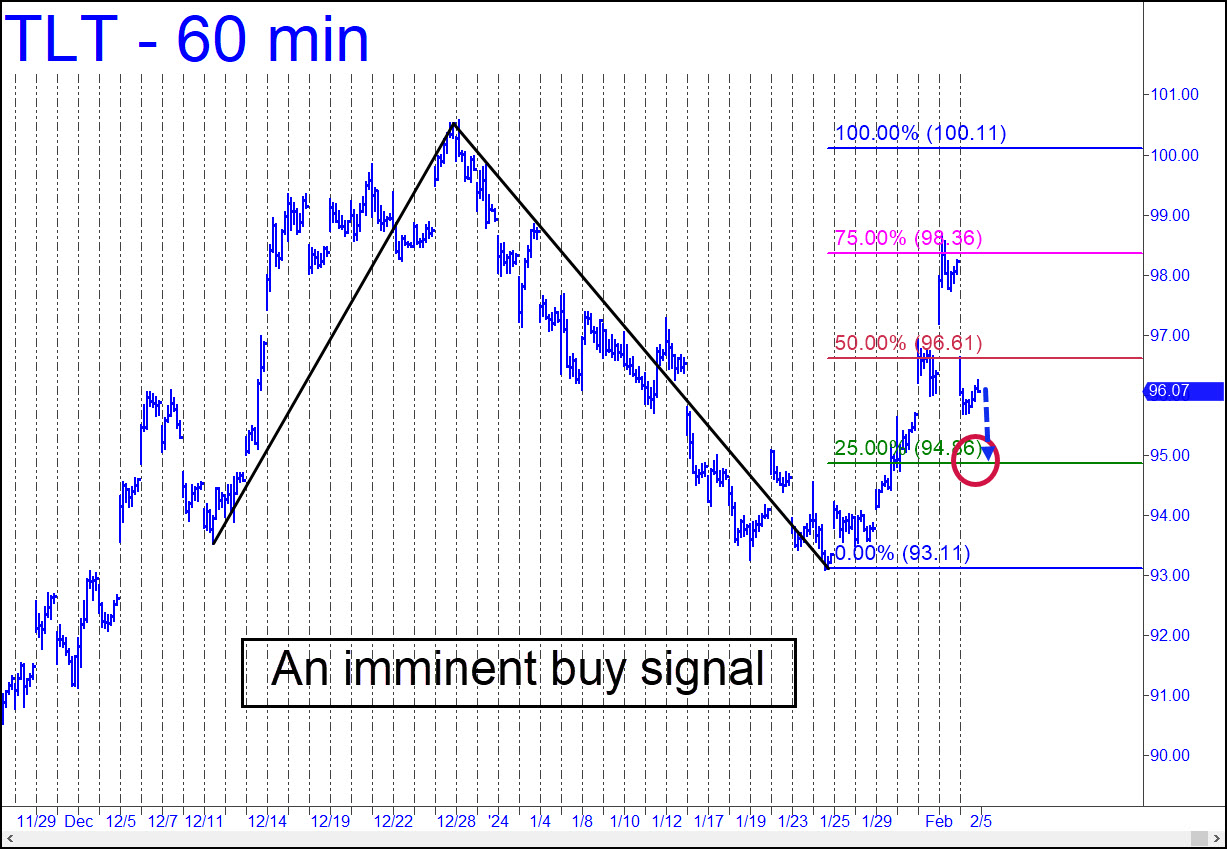
 TLT’s nasty plunge on Friday created an ostensibly bearish island-gap reversal, but my hunch is that it will shrug it off. The pattern shown offers the possibility of a high-odds mechanical buy at the green line (x=94.86). That implies that after it touches x=94.86, it will rally to at least p=96.61 without dropping below C=93.11. I may put out guidance for trading this one, so stay tuned to the chat room and your email ‘Notifications’ if you want to stay apprised. _______ UPDATE (Feb 11): TLT took a weak bounce from the green line, turning what had looked like an appealing ‘mechanical’ buying opportunity into dross. The trade, which I did not advise, has yet to be stopped out, but that’s what it might take to lighten the load sufficiently for a decent rally. The buy trigger off the new low beneath 93.10 would be 1.15 points. or 0.13 points if you want to risk getting too frazzled to squeeze off the shot. Here’s the chart.
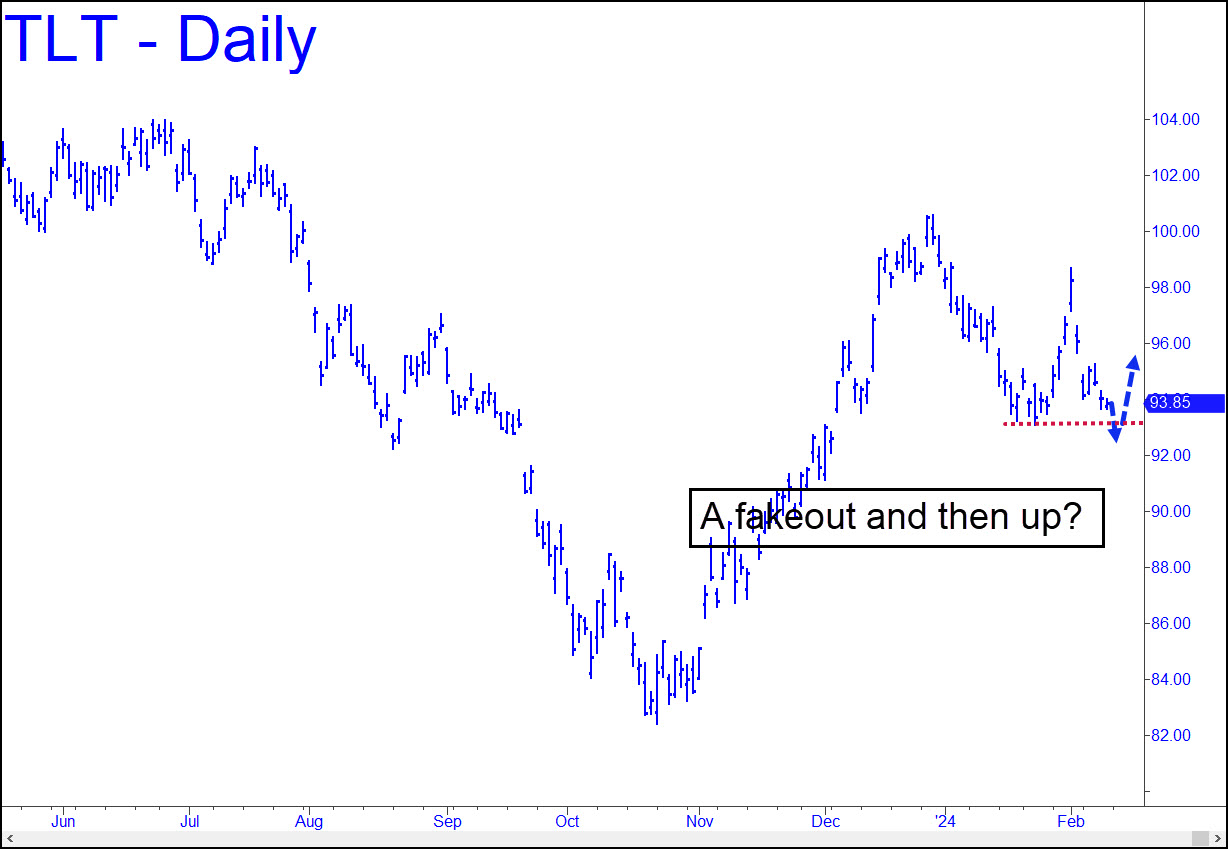
TLT – Lehman Bond ETF (Last:93.85)
