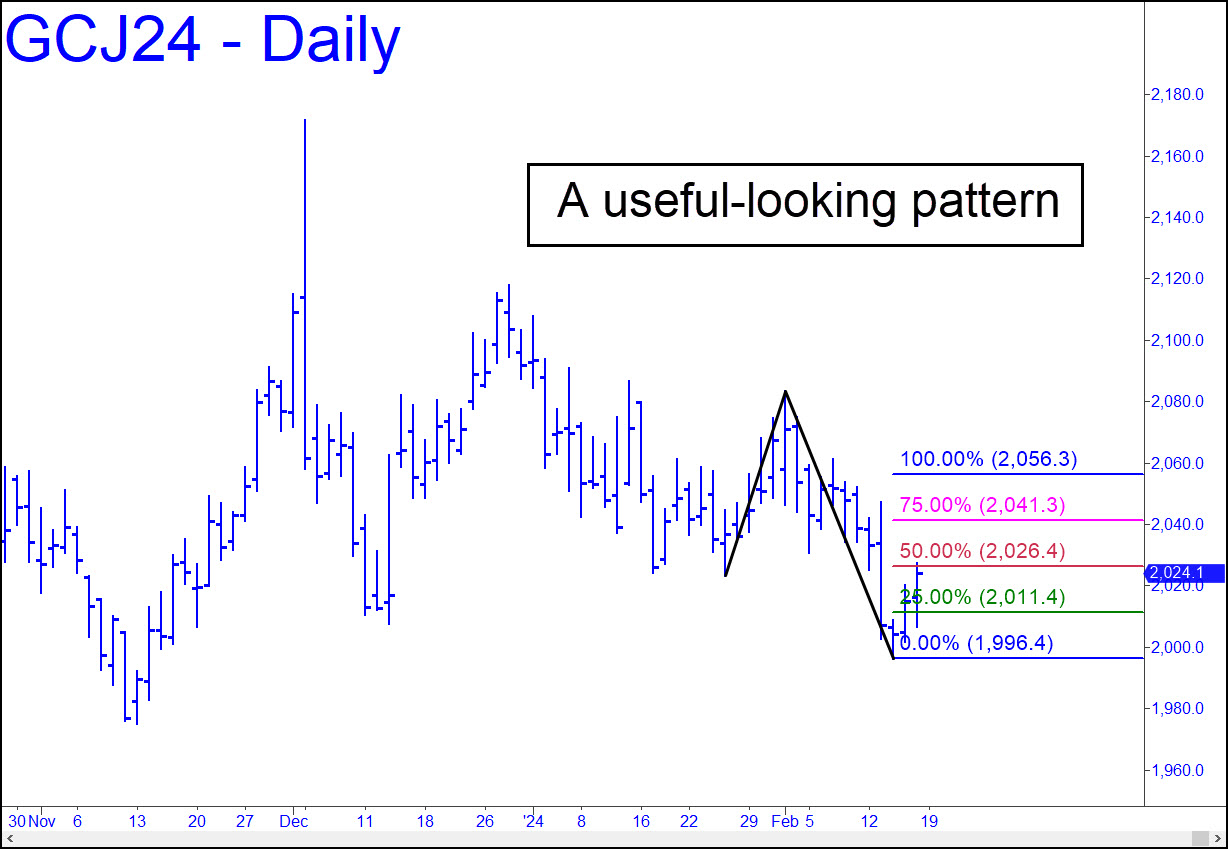
 The pattern shown, with a 2056.30 rally target, is not particularly bullish, but it looks serviceable for trading. A presumably corrective rally stalled Friday at 2026.40, the midpoint resistance, but any headway above it when the new week begins would imply the target is likely to be reached. A ‘mechanical’ buy at the green line looks promising, but I’d suggest that you act only if the pullback has come from above p=2026.40, especially if it is exceeded decisively. _______ UPDATE (Feb 23): Last week’s modest rally fell a few dollars shy of the 2056.30 target flagged above, but you can expect it to be reached within the next couple of days. It is shortable via a tight ‘reverse pattern’ for subscribers who are familiar with this tactic. The pattern can also be used for ‘mechanical’ buying at either p or x if the futures favor us with a swoon,
GCJ24 – April Gold (Last:2049.40)
