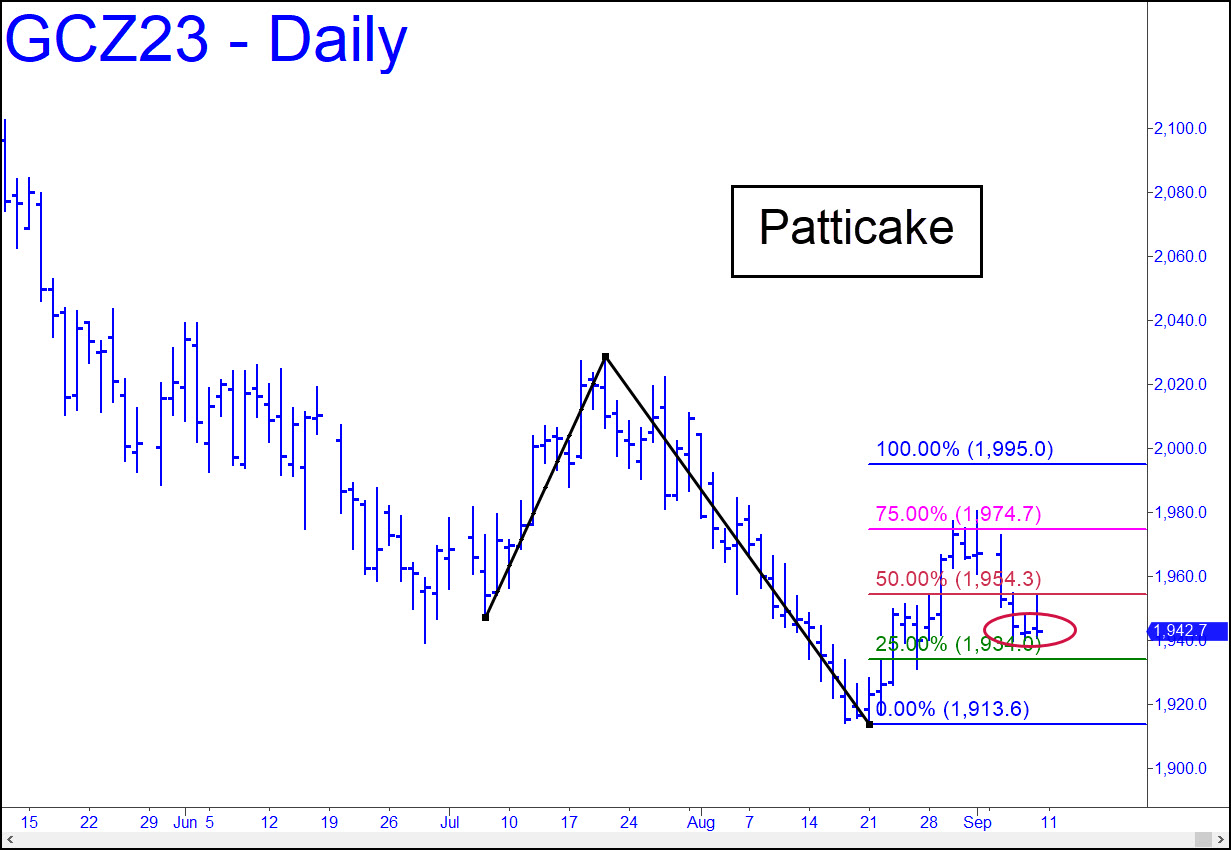
 Bulls and bears ended the week playing patticake, somewhat shy of the green lie (x=1934.0) where bottom-fishing would become mildly enticing. A one-level bounce seems likely, although the pattern’s elongated B-C leg has diminished the bullish impulsiveness of this picture sufficiently to make a run-up to D=1995.00 less than an even bet. Although that’s unlikely to stoke your enthusiasm, we should try nonetheless to get a piece of the implied ‘mechanical’ bounce that is indicated with a tight ‘reverse trigger’. Tune to the chat room for possible guidance on this. _______ UPDATE (Sep 12, 7:59 a.m. EDT): The futures have in fact come down to the green line, implying it’s time to set up a trigger for the ‘mechanical’ buy suggested above. On the hourly chart, the nearly 4-point ‘natural’ a-b is a little rich for my taste, so I am using a= 1947.30 (9-11 at 9:00 a.m.) to set up the trade with a $$1.70 TI. Based on the so-far low at 1933.40, the trade triggered a few minutes ago at 1935.10. First partial profit would be at p=1936.70. For comparison, the more natural a-b, where a=1939.50 on 9-10, would trigger at 1937.40, based on the so-far low at 1933.40. We shall see. _______ UPDATE (Sep 13, 6:20 a.m.): Although the small pattern got stopped out for a $170 loss per contract, the more ‘natural’ $4 trigger went on to produce a gain of $380 in about an hour. This is not bad, considering we went long against weak, sloppy price action. Here’s an interesting chart from Erik Volma at Gold-Eagle.com. It shows what gold prices did during stock market crashes going back to 1970.
GCZ23 – December Gold (Last:1933.40)