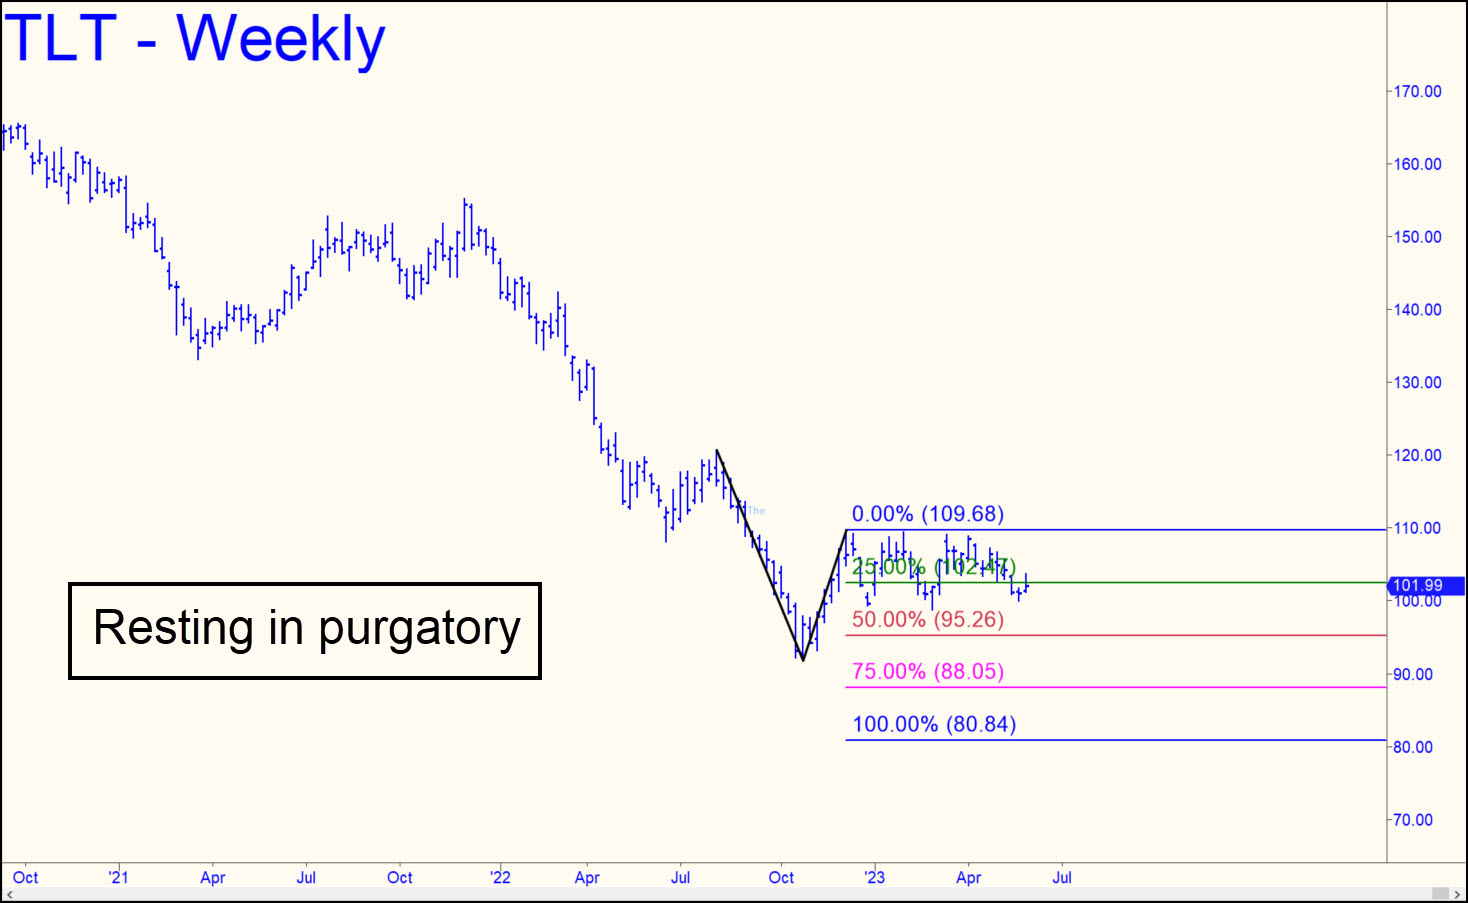
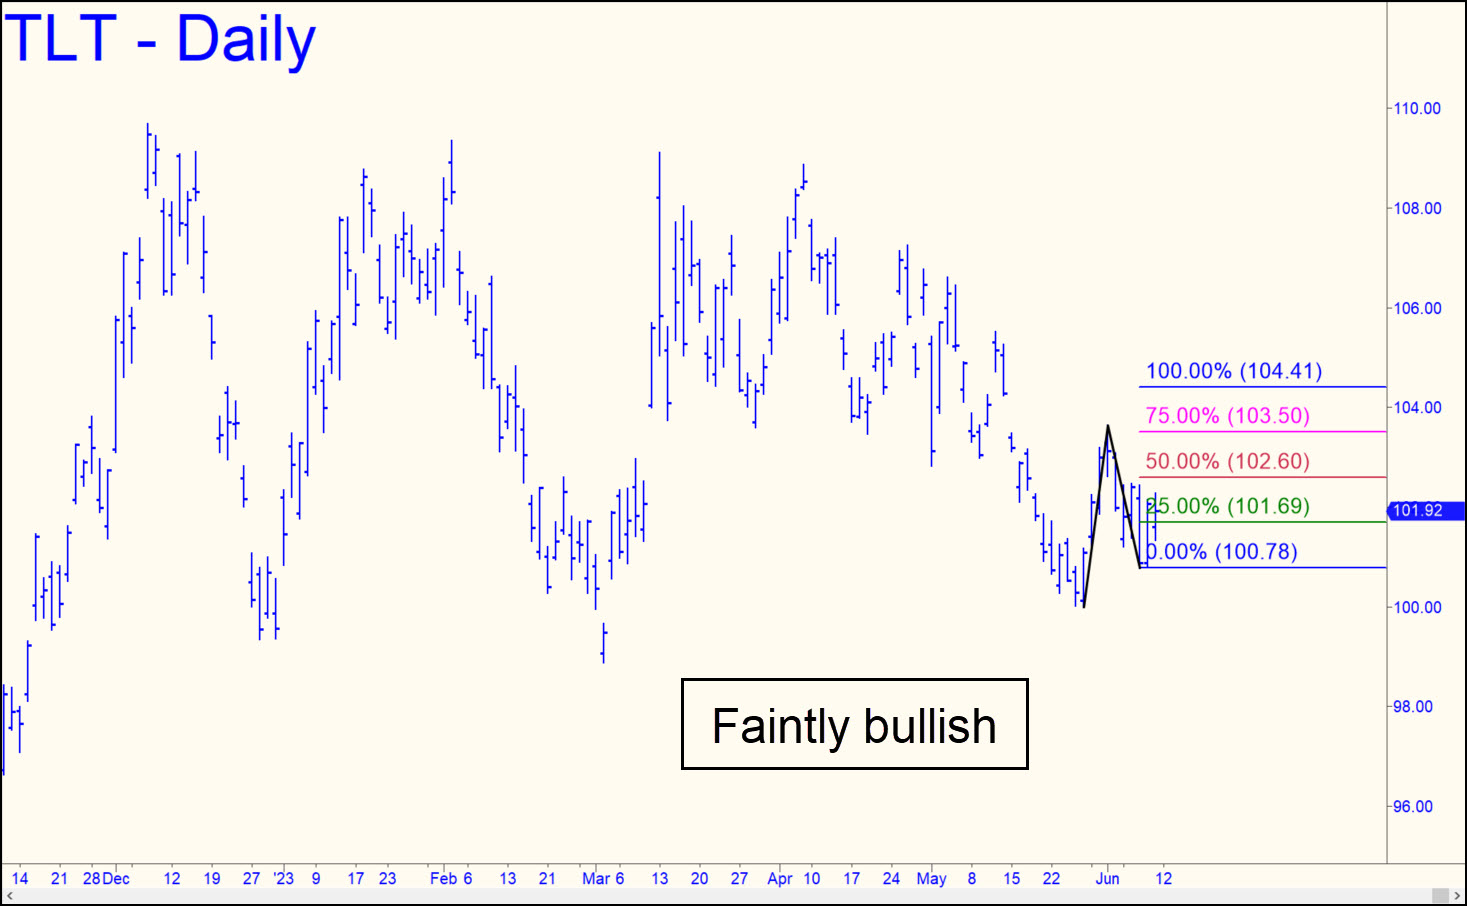
 This ETF proxy for long-dated T-Bonds has looked like hell for so long that its sideways slide since December has seemed like a relative vacation in purgatory. A drop below the distribution zone it has traversed during that time seems all but inevitable, however, and we should expect TLT to hit p=95.26 at a minimum. That’s a midpoint Hidden Pivot support and well located to set up an opportune buy against the long-term trend. We may be able to accomplish this with entry risk held to as little as 3 or 4 ticks, so stay tuned to the chat room if you care. Be sure to check ‘Notifications’ on your account dashboard as well. ______ UPDATE (Jun 10): It’s nothing to celebrate, at least not yet, but this glue horse created a bullish impulse leg on the daily chart last week that should be noted. The rally appears bound for p=102.60 at least, but an easy pop through the pivot would imply more upside potential over the near term to D=104.41. Both numbers should work for day traders looking to get short with ‘camouflage’ on the lesser charts, and ‘mechanical’ buys should provide easy wins as well.
TLT – Lehman Bond ETF (Last:101.92)