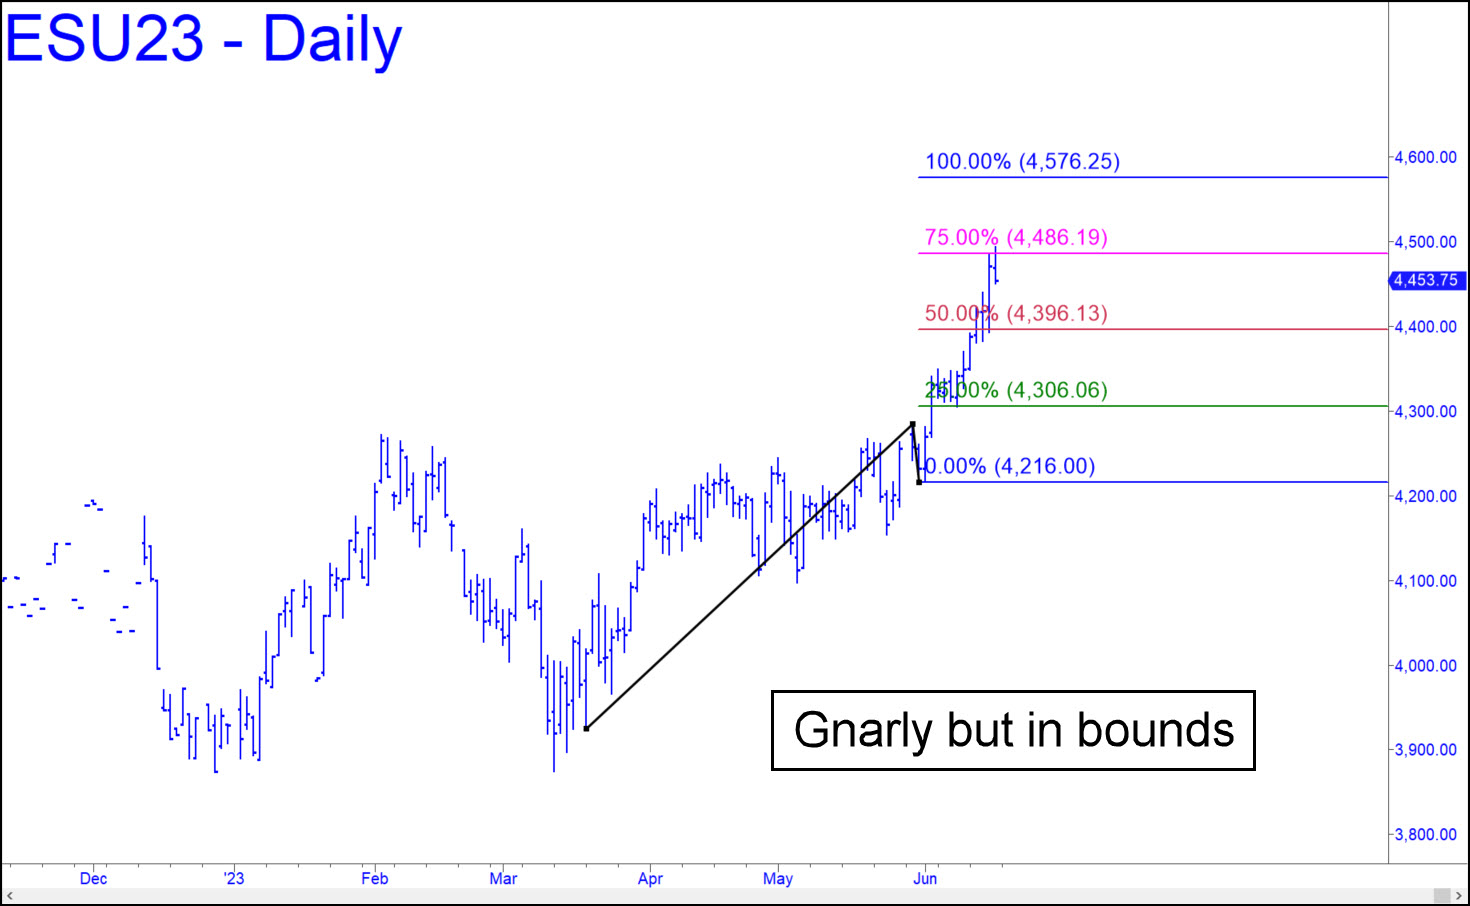
 The September contract has signaled an all but certain rally to the 4576.25 target shown in the chart (see inset). The pattern is unorthodox but meets our all of our criteria for usability. Most immediately, it would enable a compelling ‘mechanical’ buy following a corrective swoon to p=4396.13 (for which a 4336.00 stop-loss would apply). A deeper retracement to the green line (x=4306.06) would be even more enticing as a place to bottom-fish. One or both of these numbers could conceivably be reached, since, as I’ve detailed elsewhere on this page, two bellwether stocks look ripe for punitive corrections.
ESU23 – Sep E-Mini S&Ps (Last:4453.75)