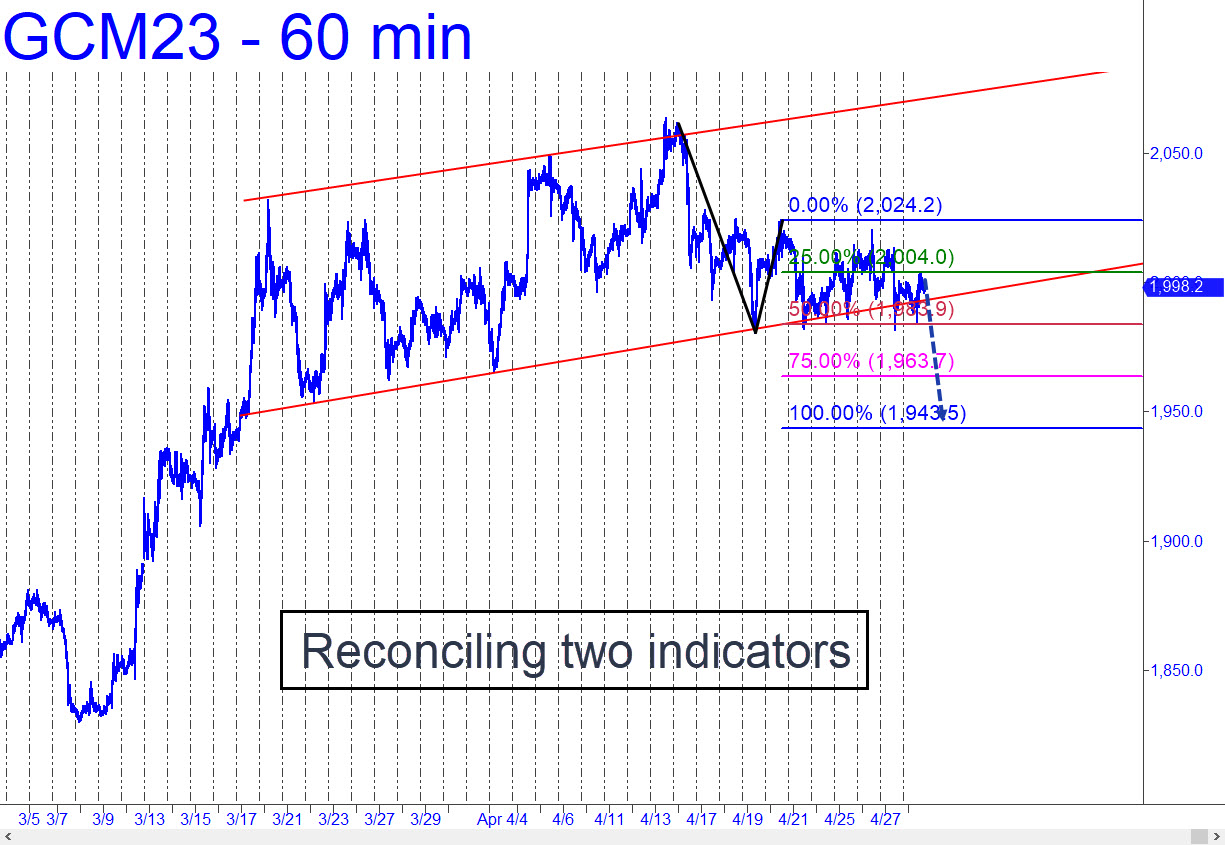
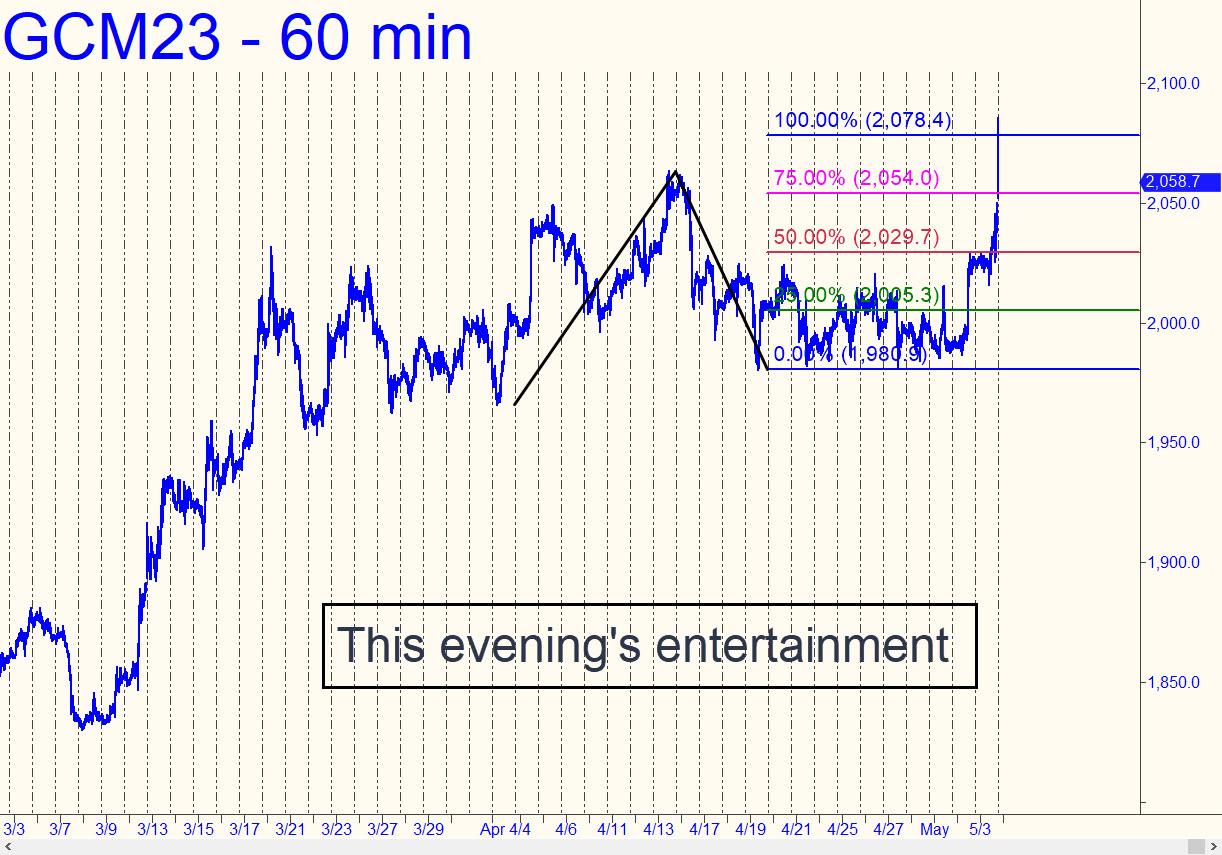
 I seldom display charts that contain two technical indicators, but in this case I wanted you to see the whole picture, which projects a likely drop to D=1943.50. The June contract has been pounding on the lower support of a channel for two weeks, but when it finally gives way, expect it to head down to D, a middling Hidden Pivot support. The pattern is gnarly enough that it should allow for bottom-fishing with a tight stop-loss (or preferably a minor ‘reverse pattern’ trigger). Please note that the futures have been on a ‘mechanical’ sell signal since rallying to the green line a week ago. ______ UPDATE (May 2, 6:20): Gold continued its wacky, daily swings with an explosive rally that exceeded the point ‘C’ high of the bearish pattern targeted on 1943.50 (see above.) Now. if buyers impale p=2029.70, look for more upside to D=2078.40 over the near term. ______ UPDATE (May 3, 6:18 p.m.): The futures got even wackier after the close, spiking nearly $50 to a so-far top at 2085 that lay 0.3% above my 2078.40 target. A wrenching $30 swoon [Update 5/4 at 8:36 a.m.: The swoon is currently $47] has followed, but hysterical buyers are probably still out there in droves. If they lift the lid anew, the futures could be bound for a more durable peak at 2183.30. A vicious pullback in the meantime to 2020.00 would trigger a ‘mechanical’ buy, stop 19https://bit.ly/3ND4uvY80.00 (A=1906 on 3-15). Here’s a fresh chart.
GCM23 – June Gold (Last:2058.50)