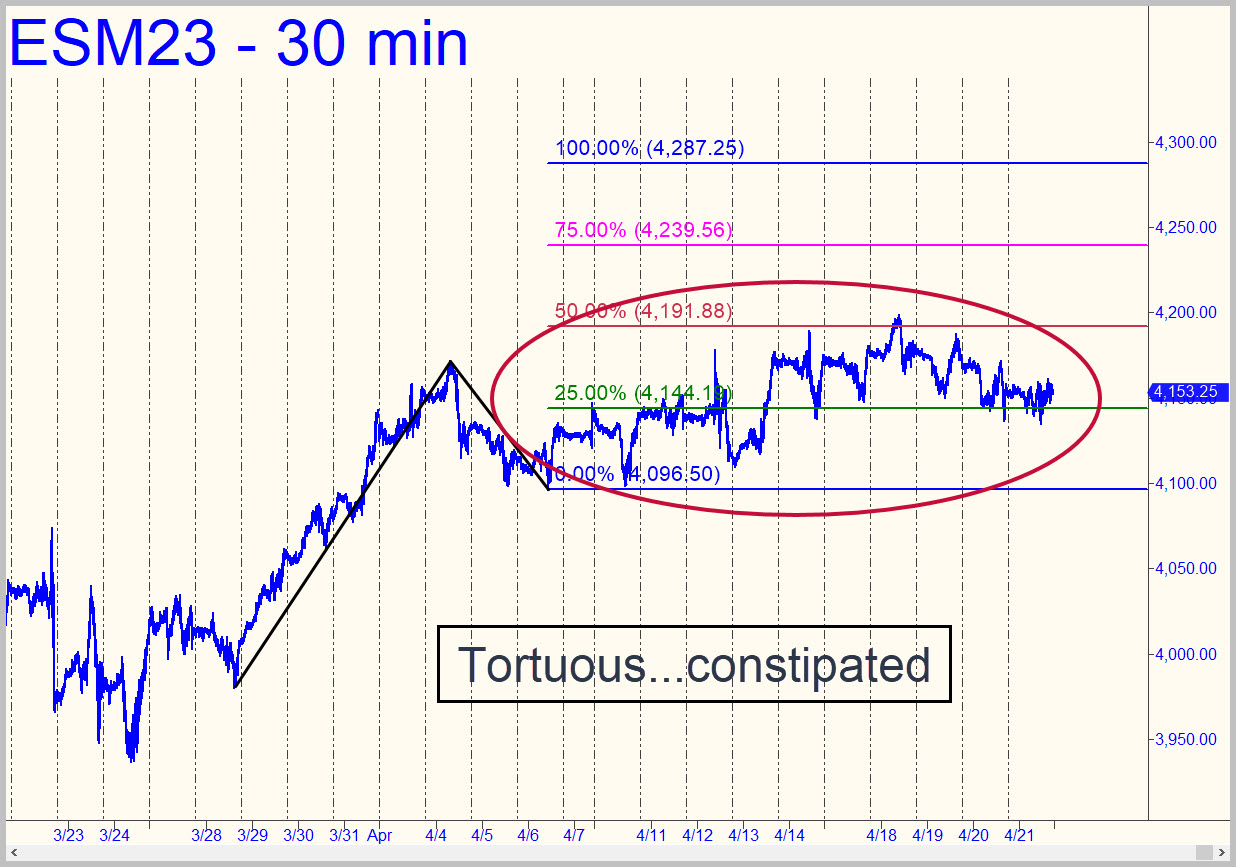
 The S&PS have been in a constipated uptrend since around April 5, tacking on just 35 points, or around 0.7%, since regaining their footing after a steep rally begun in late March. The pattern shown projects a move to 4287.25, provided buyers can push this brick decisively above p=4191.88. They seemed content to beat each other’s brains in all week, However, especially with Friday’s excruciating chop. The week ended with a slight gain on a ‘mechanical’ buy triggered Thursday at the green line. We’ll stick with the pattern shown for trading purposes since it’s all we’ve got at the moment. _______ UPDATE (Apr 23, 5:43 p.m.): Because of today’s hard selling, I’ve switched to a big, bearish reverse pattern with a 3980.00 target, or as low as 3818.00 if the higher number is breached decisively. The second target comes from fully extending the rABC pattern by using the marquee ‘A’. If today’s weakness is about to snowball, either pattern should work well for analysis or trading, including bottom-fishing at p=4058.50 of the larger pattern. Here’s the chart.
ESM23 – June E-Mini S&P (Last:4109)