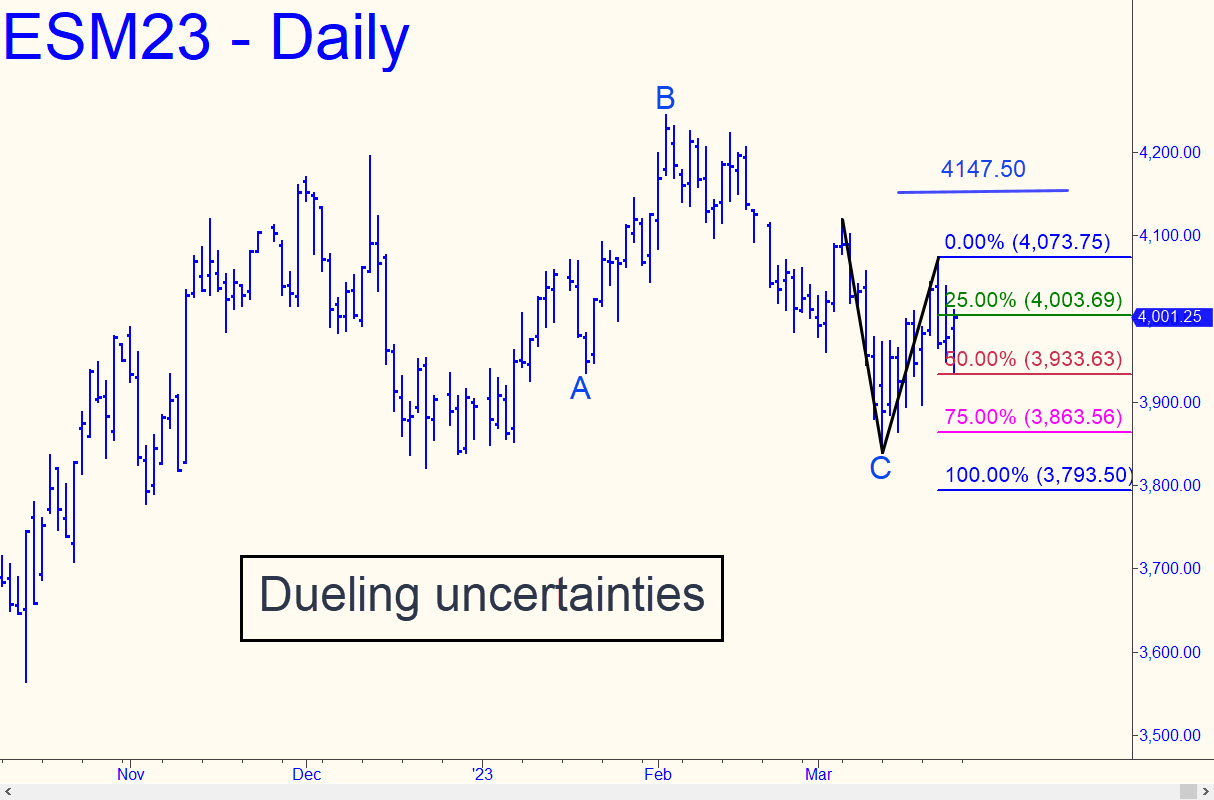
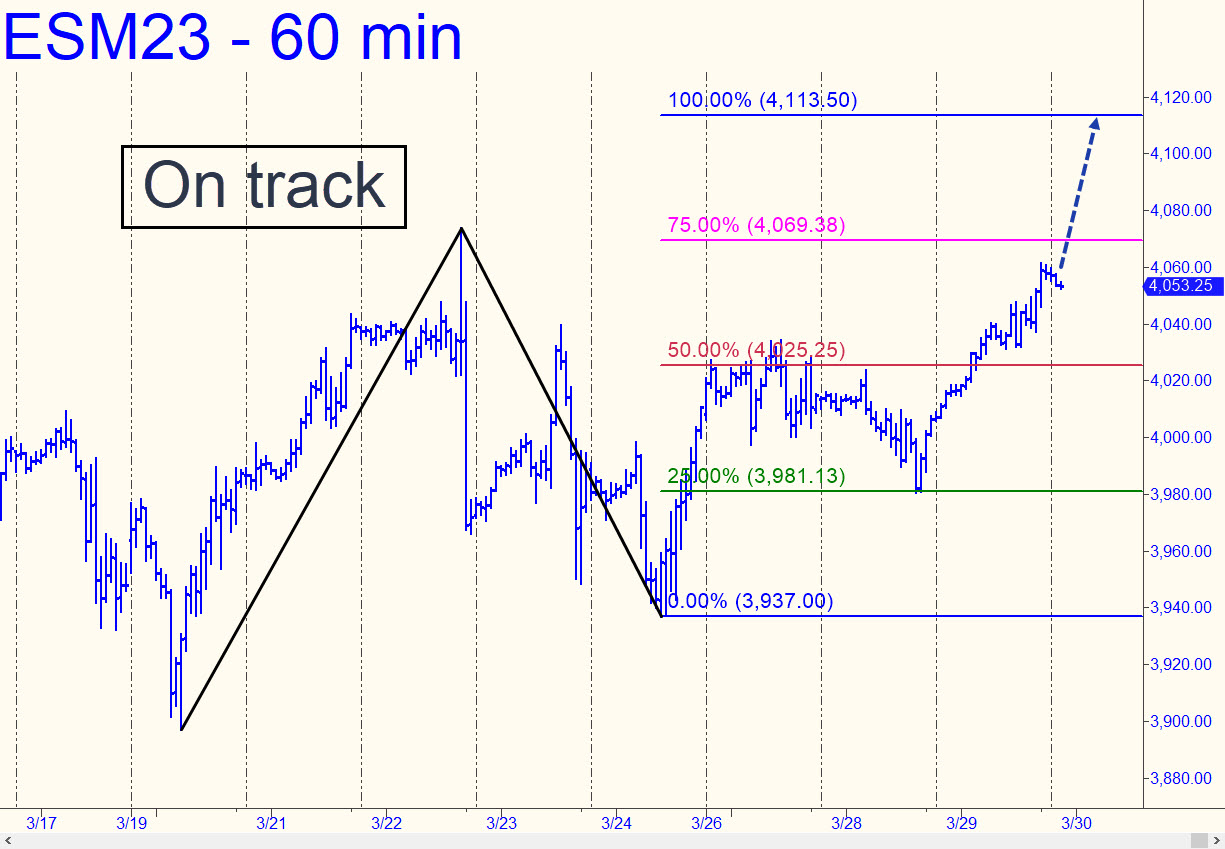
 Both the uptrend and a smaller downtrend are shown in the chart, but with a bullish bias favoring an upthrust to D=4147.50 over the near term. This is justified by an impulsive spike midweek to 4073.75 that slightly exceeded a small ‘external’ peak recorded on March 9. The smaller abc downtrend could conceivably reach D=3793.50, but I doubt this will occur in the days ahead for the reason stated above, but also because the futures reversed almost precisely from the Hidden Pivot midpoint (p) at 3933.63. That is usually a sign that the dominant trend (i.e., up) is still controlling price action. If you trade this vehicle, your bias should be bullish for now, with a focus on ‘camo’ set-ups on the intraday charts that use price bars going back to around March 1. _______ UPDATE (Mar 29, 8:20 p.m. EDT): Buyers made solid headway toward the 4113.50 target that I posted in the chat room on Tuesday, but it’s not a done deal until the futures blow past p2=4069.38. Notice that the rally began at the green line with a perfect ‘mechanical’ buy signal.
ESM23 – Jun E-Mini S&P (Last:4053.00)