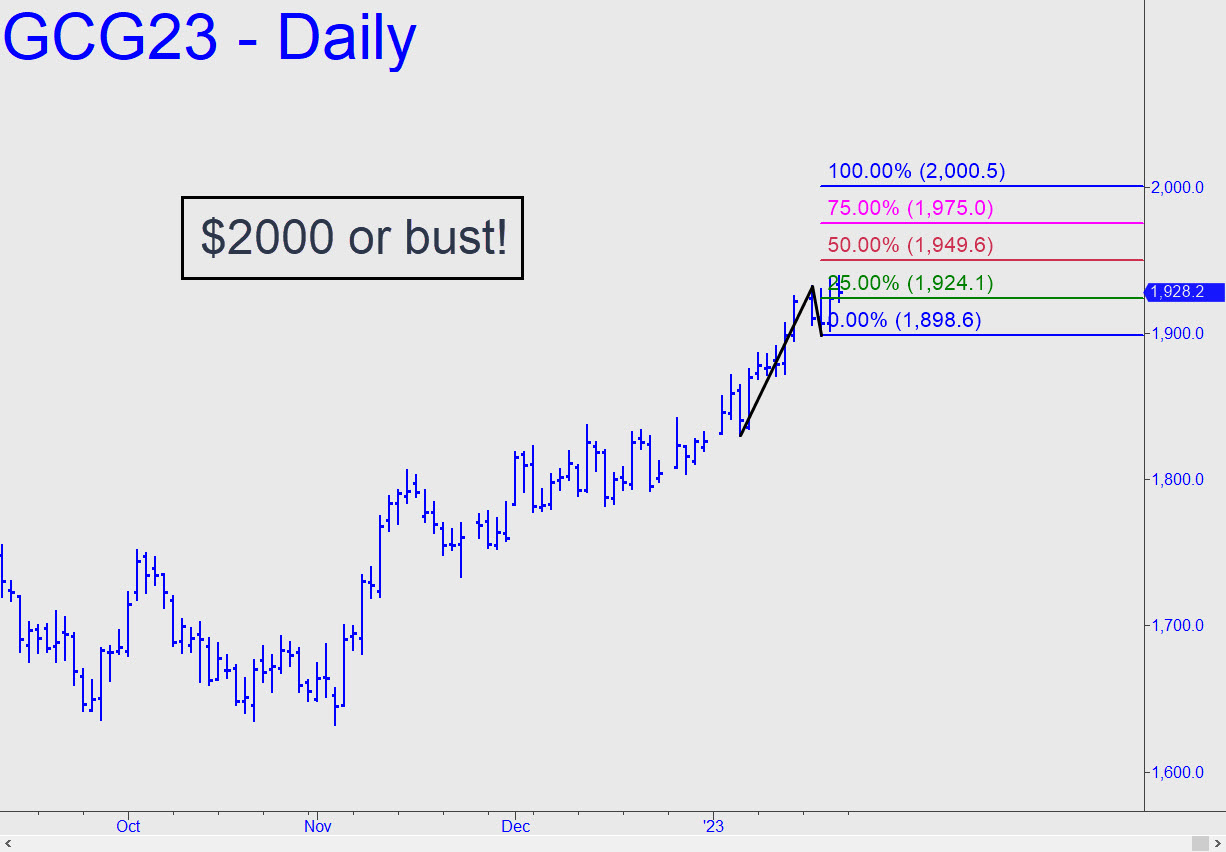
 The minor, bullish pattern shown, with a 2000.50 target, has the potential to put gold over $2000 and set up a shot at the all-time high at 2078 notched last March. Price action goes back only to a low recorded less than three weeks ago, on January 5, so I made certain the A-B segment was legitimately impulsive. You cannot see the ‘external’ peak that the leg surpassed, but rest assured it is there and that its conquest portends a continuation of the uptrend with no breach of the ‘C’ low. This implies that ‘mechanical’ trades to get long will enjoy exceptionally good odds for producing a profit. Stay tuned. _______ UPDATE (Jan 26, 12:31 p.m.): Feb Gold is tracking the touted pattern (see thumbnail inset) perfectly, with a nasty pullback from within two ticks (0.20) of p=1949.6. The pattern looks opportune for making money on either side of the market, including shorting at D=2000.50 with tight risk control. (Be prepared for some niggling stop-outs up there, since my merely having published the target could subject it to front-running.) More immediately, gold has triggered a ‘mechanical’ buy at x=1924.10, stop 1898.50. The usual caveats apply, but I would encourage you to paper-trade this one if you lack complete confidence in the ‘mechanical’ set-ups I’ve been posting in the chat room. About 90% of them have been profitable, not that that is a guarantee of future success. Here’s the chart.
GCG23 – February Gold (Last:1927.60)