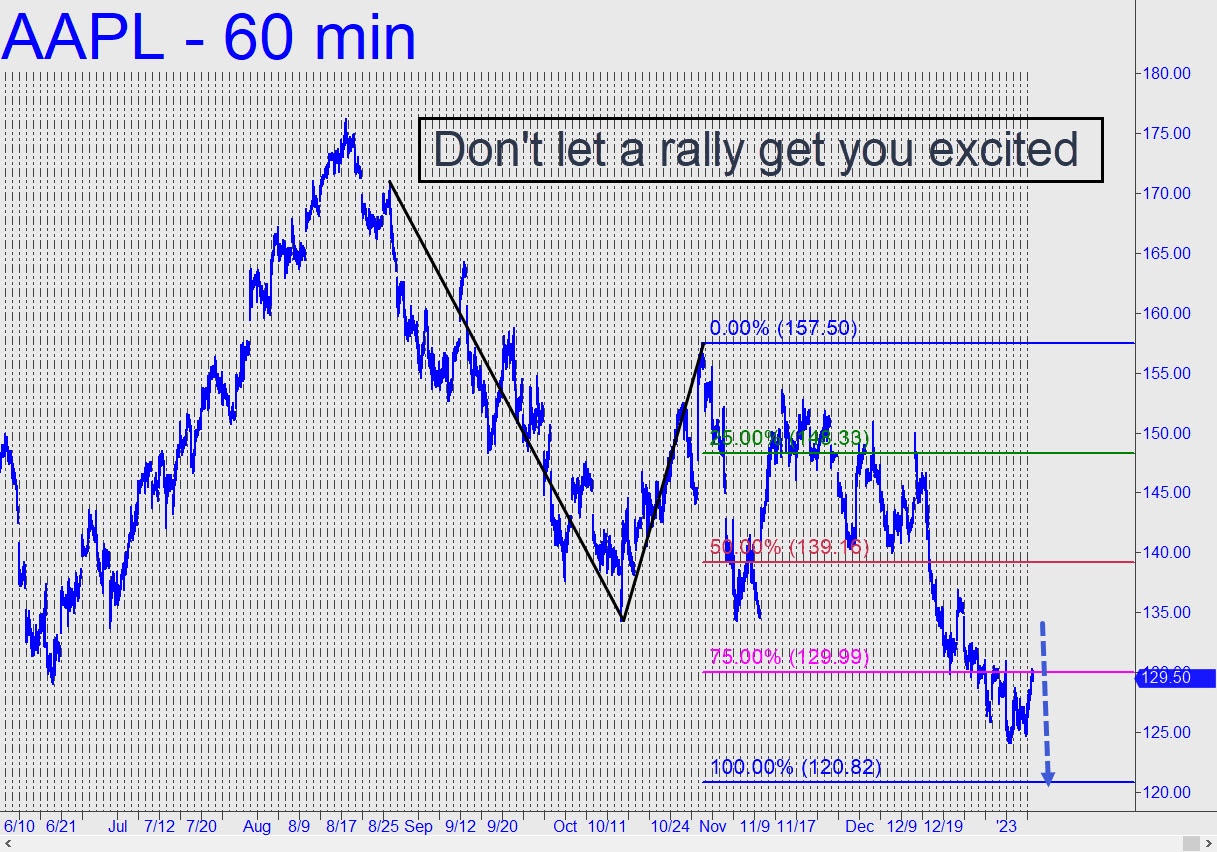
 The chart uses a conventional pattern yielding a downside target at 120.82 that nearly matches an important one we derived earlier from a trendline. It will allow us to trade precise levels if the opportunity should arise. So far, though, even after Friday’s sharp, go-along rally, AAPL still failed to generate an impulse leg on the daily chart. That would occur if buyers push this hoax above last Tuesday’s 130.90 peak, but even then I wouldn’t get too excited. A counterintuitive feature of this chart is that if the rally were to go ballistic, hitting x= 148.33, that would trigger a compelling ‘mechanical’ short. With close observation, though, we may be able to get short well beneath that level, presumably in a boring ‘discomfort zone’ where the rally seems fated to die.
AAPL – Apple Computer (Last:129.50)