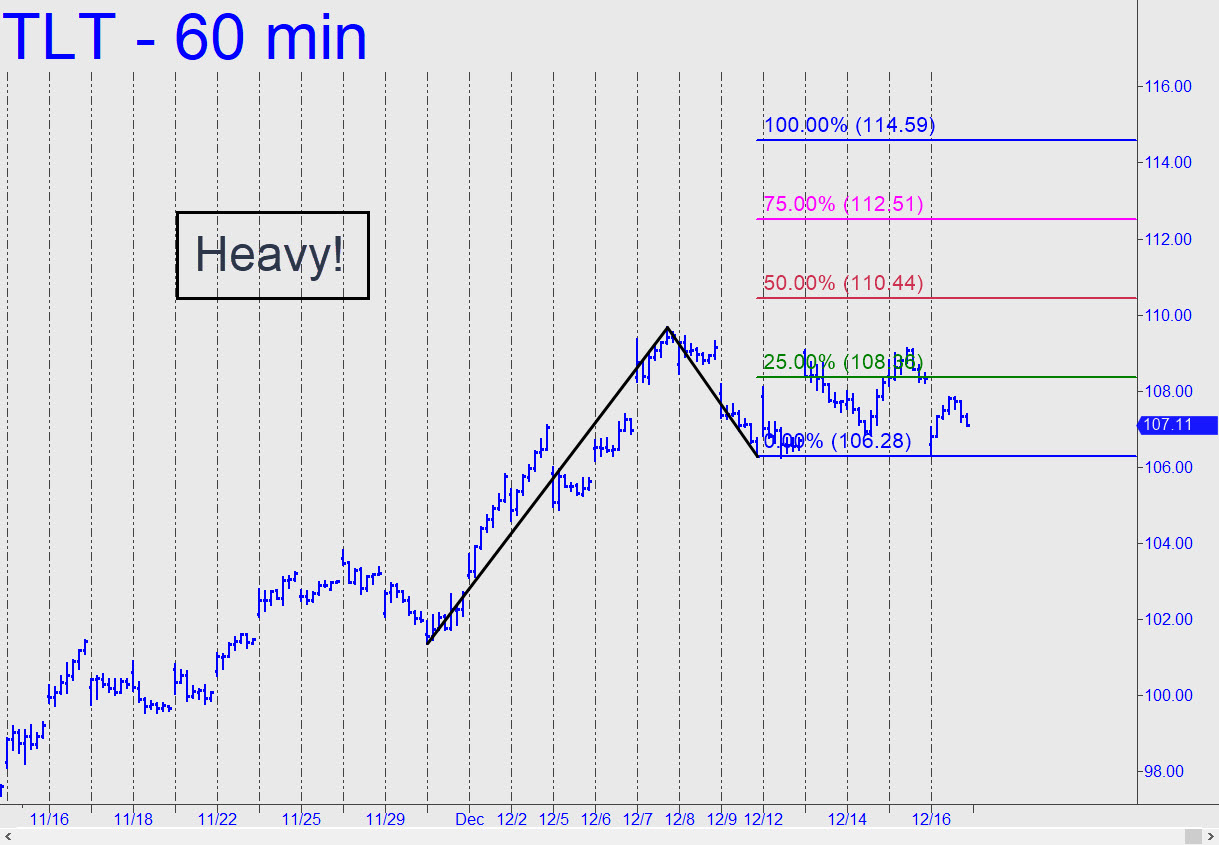
 TLT turned leaden last week, failing to capitalize on two conventional ‘buy’ signals at the green line. The still-bullish pattern shown seems likely to be negated this week with a move or feint beneath C=106.28, but I doubt this would mark the beginning of a significant downturn. TLT should still be viewed nevertheless as in a bear rally with potential to 116.71 or even 124.99 over the next 6-10 weeks (rABC on daily, where a=139.01 on 3/18/20). ______ UPDATE (Dec 21, 8:30 p.m.): I’ve shifted to a somewhat larger ‘reverse’ pattern, since the rally target of the smaller one was slightly exceeded. The pattern is unorthodox, but it’s all we’ve got for now. Its usefulness will be tested if TLT drops to the green line (x=96.79), triggering a ‘mechanical’ buy signal (stop 91.84).
TLT – Lehman Bond ETF (Last:103.70)