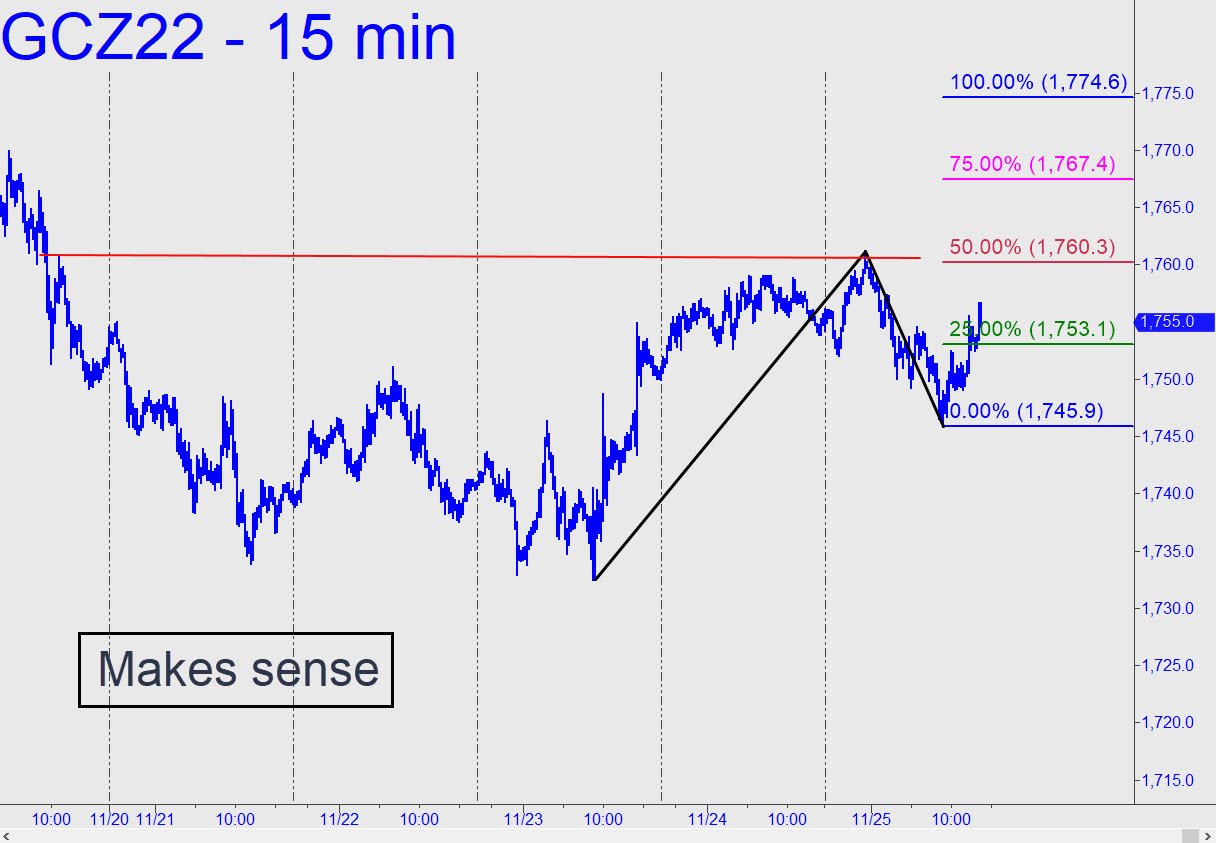
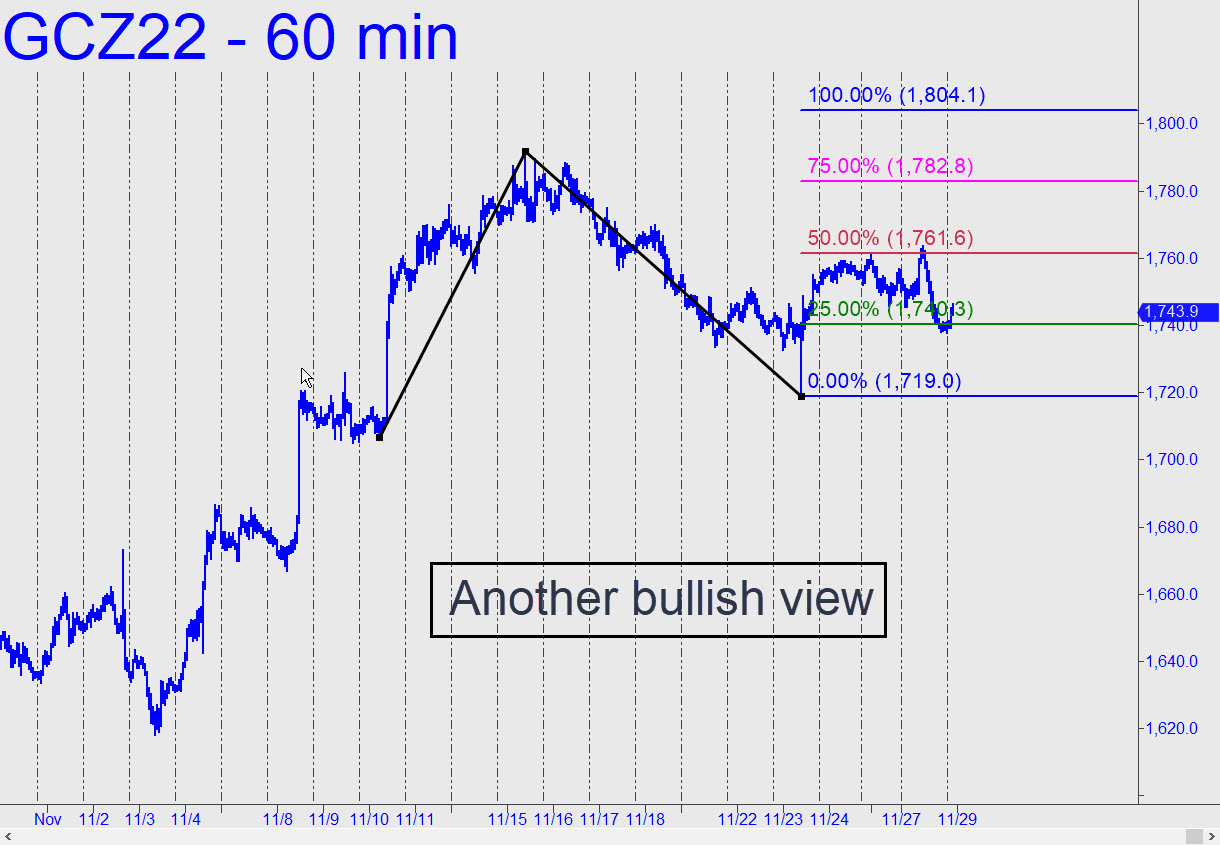
 Friday’s high surpassed a look-to-the-left peak recorded a week earlier, refreshing the bullish impulsiveness of the intraday charts. The original chart contained a bad print down at 1719.00, but cleaning it up has produced a serviceable pattern with a midpoint resistance at 1760.30 that can serve as a minimum objective. A further run-up to D=1774.60 would become an odds-on bet if buyers shred their way past 1760 — or better yet, close above it for two consecutive days. ______ UPDATE (Nov 28, 9:57 p.m.): Here’s a fresh chart that salvages a bullish outlook despite today’s nasty reversal. It also treats the 1719.00 low of last Wednesday’s wack-o downdraft as though it actually happened, which appears to be the case. The chart has signaled a so-so ‘mechanical’ buy at x=1740.30 (stop 1718.90) off an intraday high that did not quite reach our sweet spot around 1772.00. ______ UPDATE (Nov 29, 11:02 a.m.): Here’s an update on that last chart. It shows the February contract with a D target at 1818.50. Precise play off p=1776.00 suggests this pattern will work well for trading and assessing trend strength. It has already yielded a ‘mechanical’ buy at the green line that could have been worth as much as $2000 per contract overnight.
GCZ22 – December Gold (Last:1769.20)