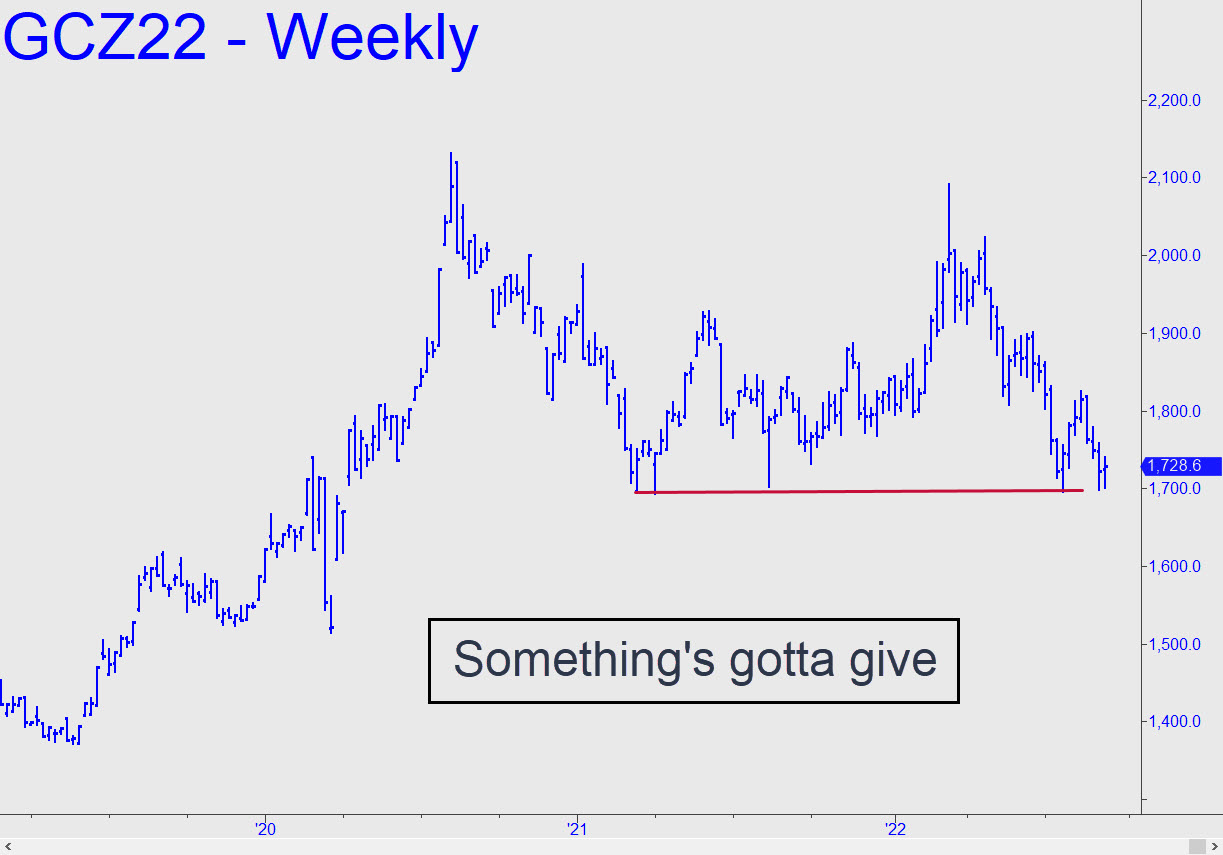
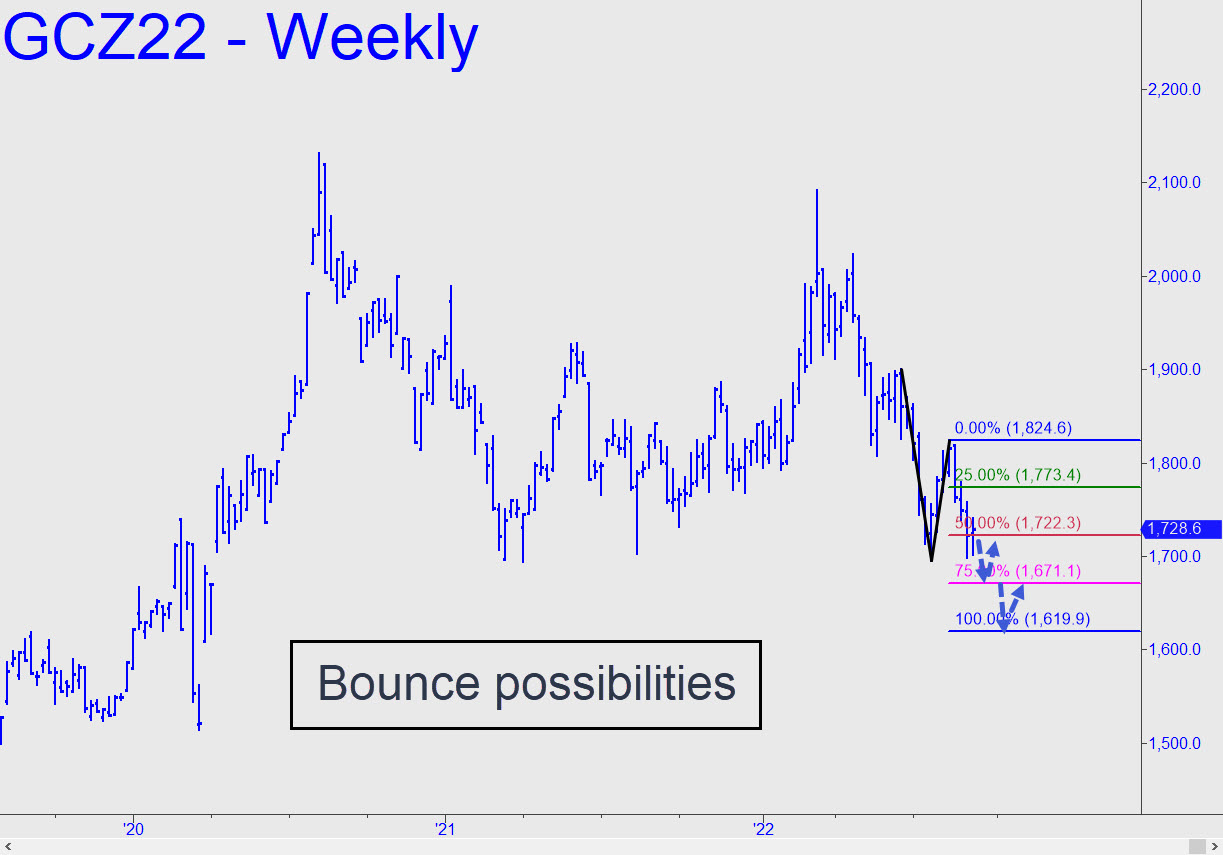
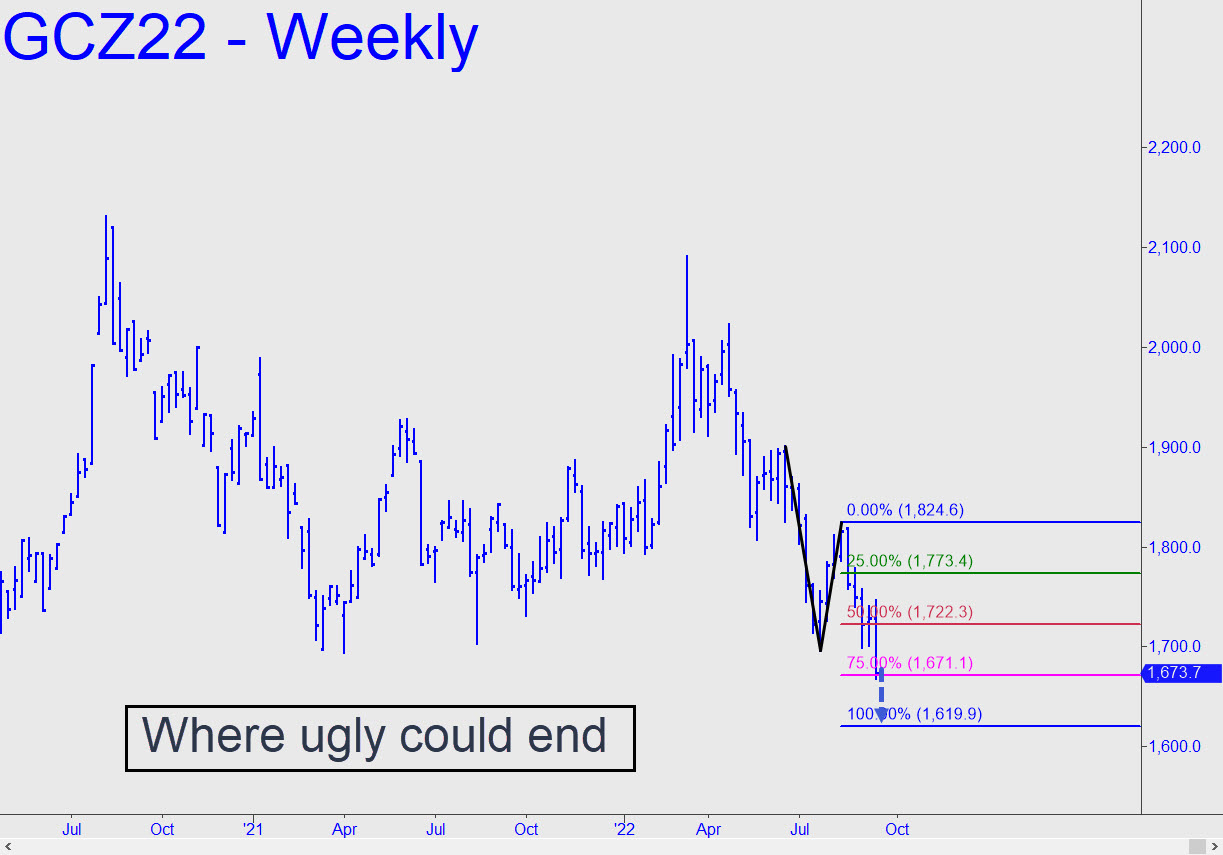
 The last time gold slipped into a discomfort zone was the third week in July, just before it trampolined from the tiny space between two important lows on the weekly chart (see inset). It is probably fixing to do something at least as irksome now, presumably by bouncing with equal or greater ferocity from somewhere beneath the breakdown line shown in the chart. My hunch is that this will not occur following a merely marginal penetration of the line, but rather from either p2=1671.10 or D=1619.90 of this pattern. Use the former for now as a minimum downside target. And yes, just in case, we should allow for the vexatious possibility that, with no breakdown at all, the low is already in. We cannot be fooled about this if we monitor impulse legs on the lesser charts for the next couple of weeks. ______ UPDATE (Sep 12, 10:09 p.m.): My distrust of this rally is so intense that we’ll need to judge it strictly by-the-book. That means we can at least withhold our enthusiasm until such time as the 1757.90 ‘external’ peak created August 28 on the way down is exceeded. _______ UPDATE (Sep 13, 7:03 p.m.): Gold is looking so atrocious that a reversal from near 1700, where three lows have occurred since July 21, seems assured. Anything in the range 1699.60-1703.10 will be in the discomfort zone and therefore opportune for bottom-fishing with a tight reverse-pattern. ______ UPDATE (Sep 15, 4:14 p.m.): It’s getting ugly. Sellers drove gold through the round number 1700.00 with such ease that it became resistance before it even had a chance to be tested as support. Shifting to the weekly chart yields a new downside target at 1619.90, a Hidden Pivot that can be used as a minimum downside projection if p2=1671.10 doesn’t hold.
GCZ22 – December Gold (Last:1673.90)