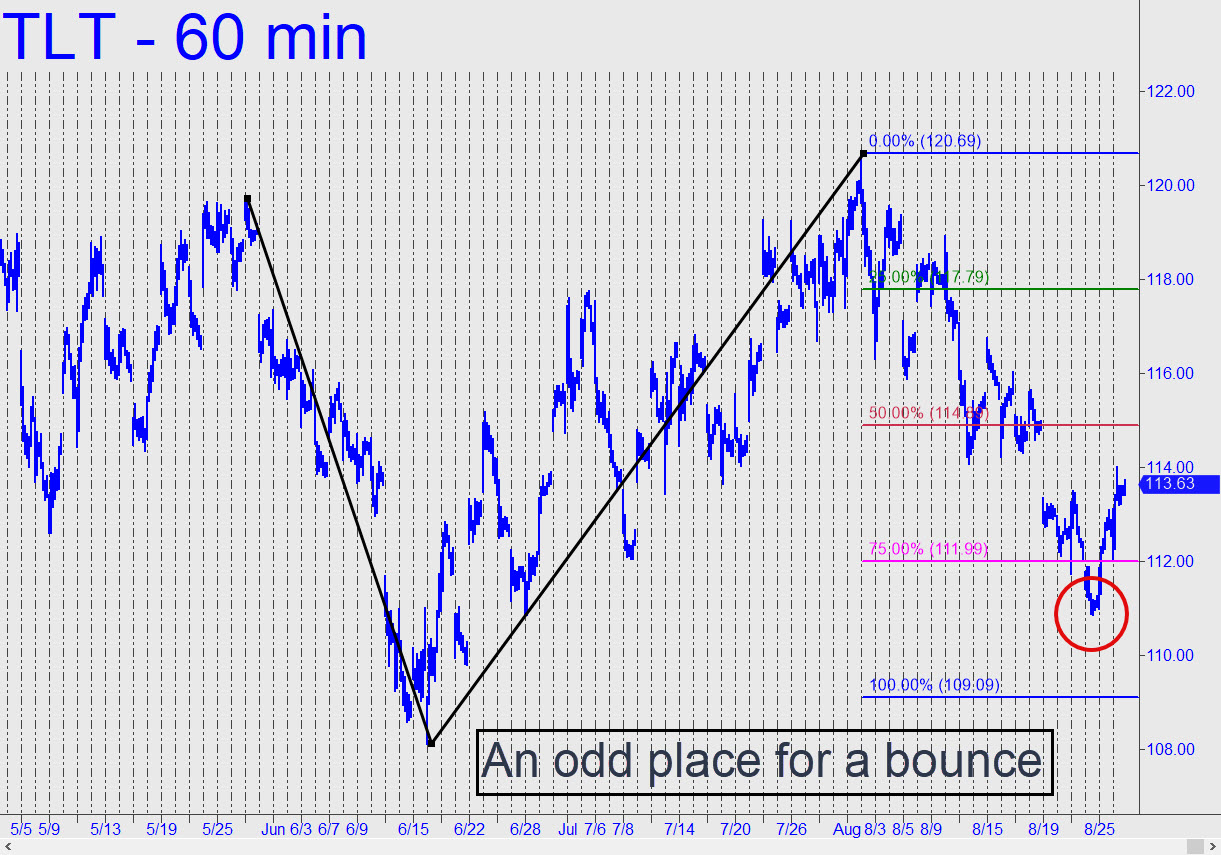
 The pattern we’ve been using for several weeks, with a still unmet 109.09 downside target, is clear and compelling, implying that this sharp bounce from well north of it is not destined for greatness. Even so, we’ll give the rally the benefit of the doubt, especially if it should continue on up to 116.75, where a distinctive ‘external’ peak made two weeks ago on the way down cries out to be tested. Please note that a print at p=114.89 would trigger a so-so ‘mechanical’ short, stop 116.82, and that if the trde were to get stopped out, TLT would have an even-odds chance of breaking out above C=120.69 of the bearish pattern. _______ UPDATE (Sep 1, 11:10 p.m. EDT): TLT has bounced tentatively from within a hair of the 109.09 target, so there’s a good chance the rally could get legs. _______ UPDATE (Sep 7, 12:20 a.m.): The way sellers have crushed a 109.09 ‘hidden’ support with barely a bounce suggests TLT is headed significantly lower. A test of 100 seems almost too obvious to consider, but I’ll have a closer look as soon as I am able to access Tradestation.
TLT – Lehman Bond ETF (Last:107.49)