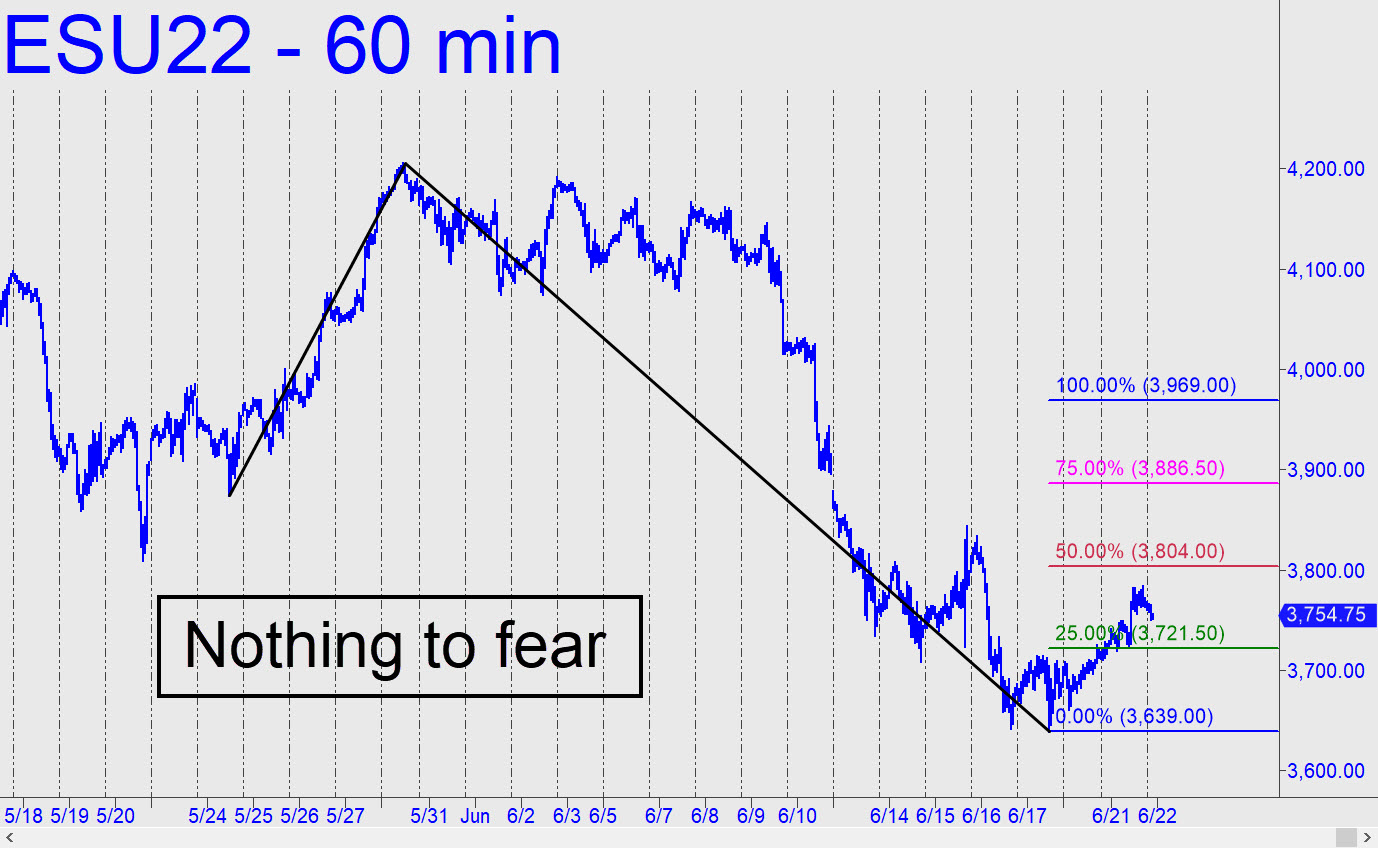
 The chart is intended to simplify your trading decisions and mitigate the anxiety that has stalked the chat room lately. Is this the big short squeeze we’ve all known was coming? I doubt it. But why should it matter? It’s all just impulse legs, and the one shown has generated ‘mechanical’ levels that can be traded or used confidently to assess the strength and sticking power of the rally. For starters, if buyers impale the 3804.00 midpoint (p) over the next day or two, and especially if they close ES above p, you can bet that it’s going to reach D=3969.00. Any one-level pullback enroute will be tradeable ‘mechanically’ once p has been exceeded, but check in the chat room if you’re uncertain about how to do this, since many have mastered the trick. It will a require ‘camouflage’ set-up on the very lesser charts, since conventional entry risk would be around $2500 per contract. ______ UPDATE (June 22, 9:15 p.m.): The rally reached p=3804.00, overshooting it by a zillionth of an inch. This confirms that the pattern will work for any purpose we choose, whether forecasting, trading ‘mechanicals’ or shorting at D. ______ UPDATE (Jun 24, 12:25 a.m.): After spending two days ineffectually head-butting p, DaBoyz had to cheat to push past it under the cover of darkness. This put the futures on a certain path to at least 3886.50, the secondary (p2) pivot.
ESU22 – Sep E-Mini S&P (Last:3829.75)