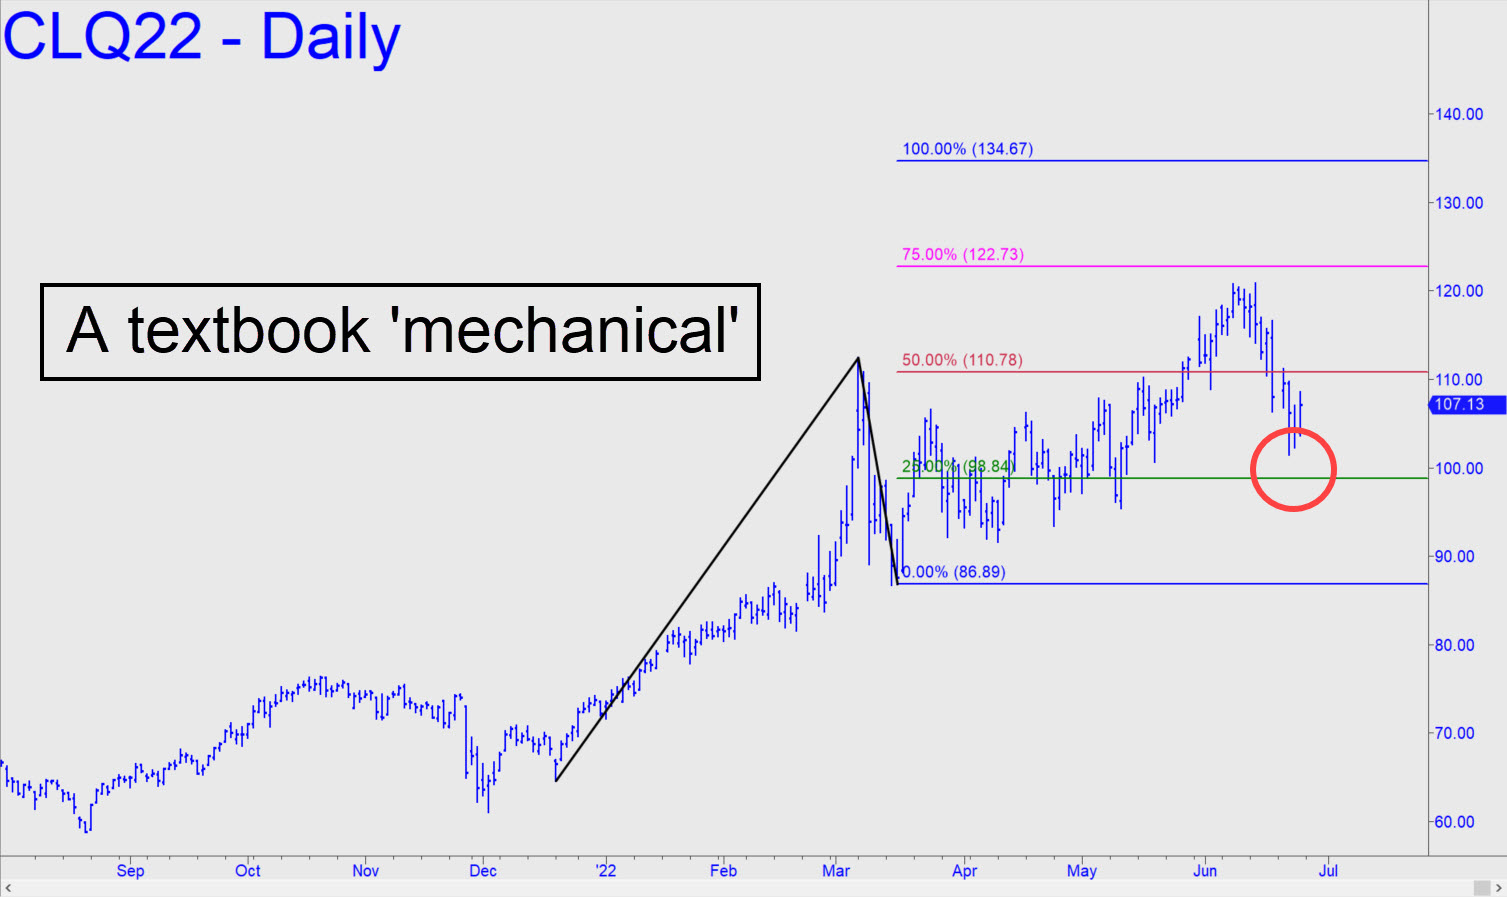
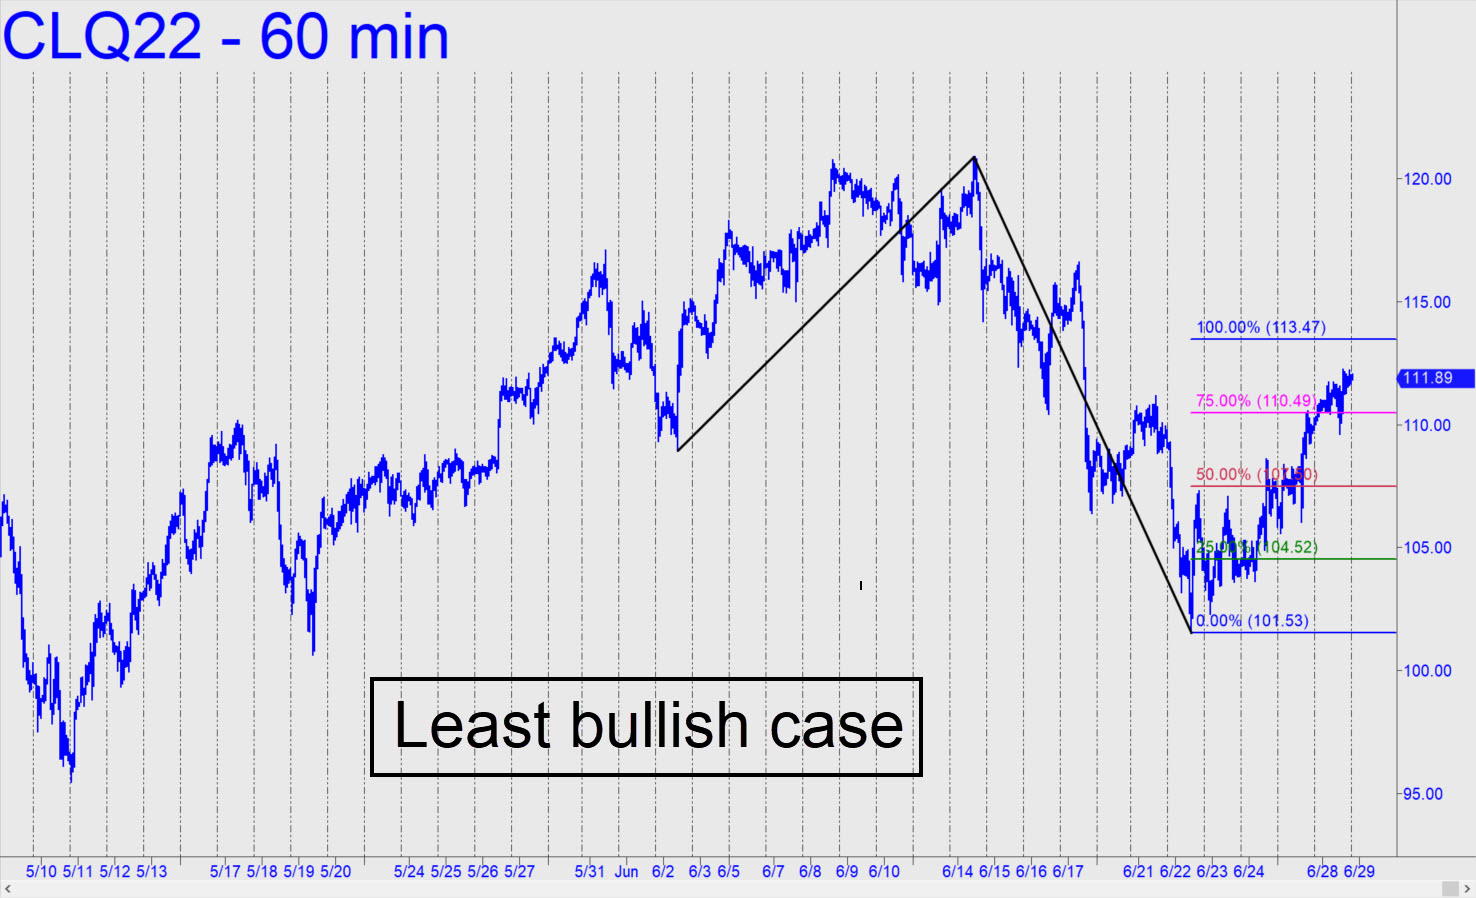
 Crude ended the week with an unimpressive rally that exceeded no prior peaks. Accordingly, I’ll suggest sticking with our plan to wait for a pullback to x= 98.84 (the green line) before we do any buying. Since the by-the-book stop-loss at 86.88 equates to entry risk of nearly $12,000 per contract, we’ll need to initiate the trade using a ‘camouflage’ set-up on the very lesser charts. There are no guarantees the required pullback will occur, but I’ll post alternative ideas for getting long only if chat-roomers demonstrate keen interest. _______ UPDATE (Jun 28, 8:10 p.m. EDT): This chart, with a 113.47 rally target, is the least bullish picture I can draw at the moment. Why so cautious? I am bearish on the global economy is why, particularly China’s manufacturing sector, which sets oil prices at the margin. Yes, an exogenous geopolitical shock could send quotes soaring, and we must always be ready to concede that that’s possible. It would become a likelihood in my view if the August contract were to blow past 113.47. This squares with my view that market trends and price action determine the news, or at least our perception of the news, rather than the other way around. Whatever happens, the ‘conservative’ rally pattern I’ve drawn cannot but tell us whether the uptrend is just getting warned up. If the futures close above 113.47, I’d infer they were bound for a minimum 116.70, or even 121.75 if the lower resistance gives way. That target was calculated by sliding ‘A’ down to the May 19 low at 100.66, turning a reverse pattern into a conventional one. ______ UPDATE (Jun 29, 6:34 p.m.): Crude means to fool us with psychopathic behavior, but it’s all just impulse legs, isn’t it? The futures retreated sharply after exceeding the 113.47 target by 58 cents, or 4.3%; however, as noted, they will need to close above that number to warrant our bullish attention. My instinct is to bottom-fish Thursday with a set-up predicated on a turn-up near 107.92; or if any lower, near 105.52. Those are, respectively, p2 and d of a 60-min reverse pattern where a=110.06 on 6/21. _______ UPDATE (June 30, 6:57 p.m.): The last update not only got the downtrend right, the 105.52 correction target nailed the low of a $2.75 bounce within 0.3%. Here’s the rABC pattern I used for the forecast. Many subscribers reported making hay with this one. The bigger-picture ‘mechanical’ buy tied to a 98.84 target of larger degree remains valid. _______ UPDATE (Jul 5, 8:12 p.m.): Patience has paid off with August’s Crude’s plunge today to 98.84, where I’d recommended a mechanical buy on June 19. This trade rates a succulent ‘7.8’, but it is for experienced Pivoteers only, since initial risk on four contracts is nearly $48,000. An rABC pattern from the 60-minute chart has already triggered entry at x=98.46 that risked $4120 theoretical on four contracts. It also allowed an exit six hours later at 101.55 for a theoretical profit of as much as $3090 per contract. Here are the pattern’s coordinates: a=107.29 on 7/4, p=99.49 and d=101.55. If you kept 25% of the position for a swing at the fence, a stop-loss just below c=97.43 would be logical.
CLQ22 – August Crude (Last:101.87)
