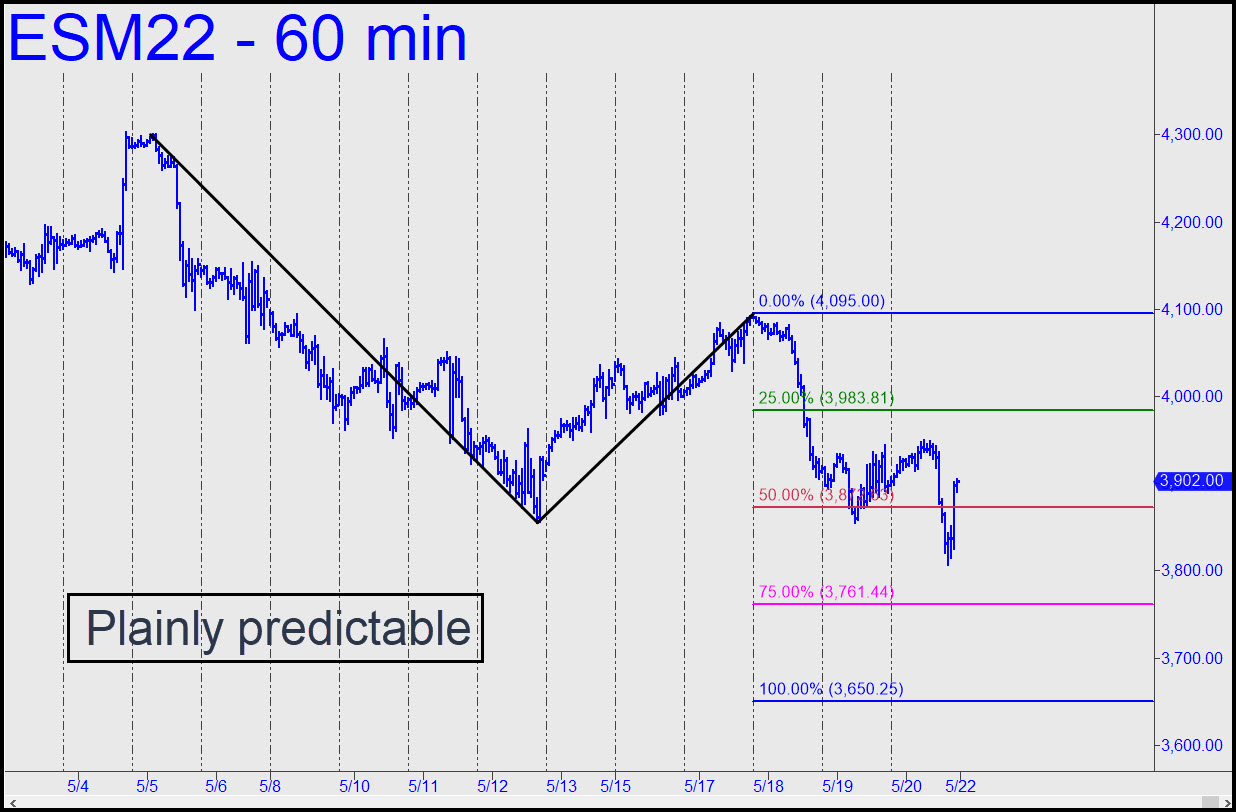
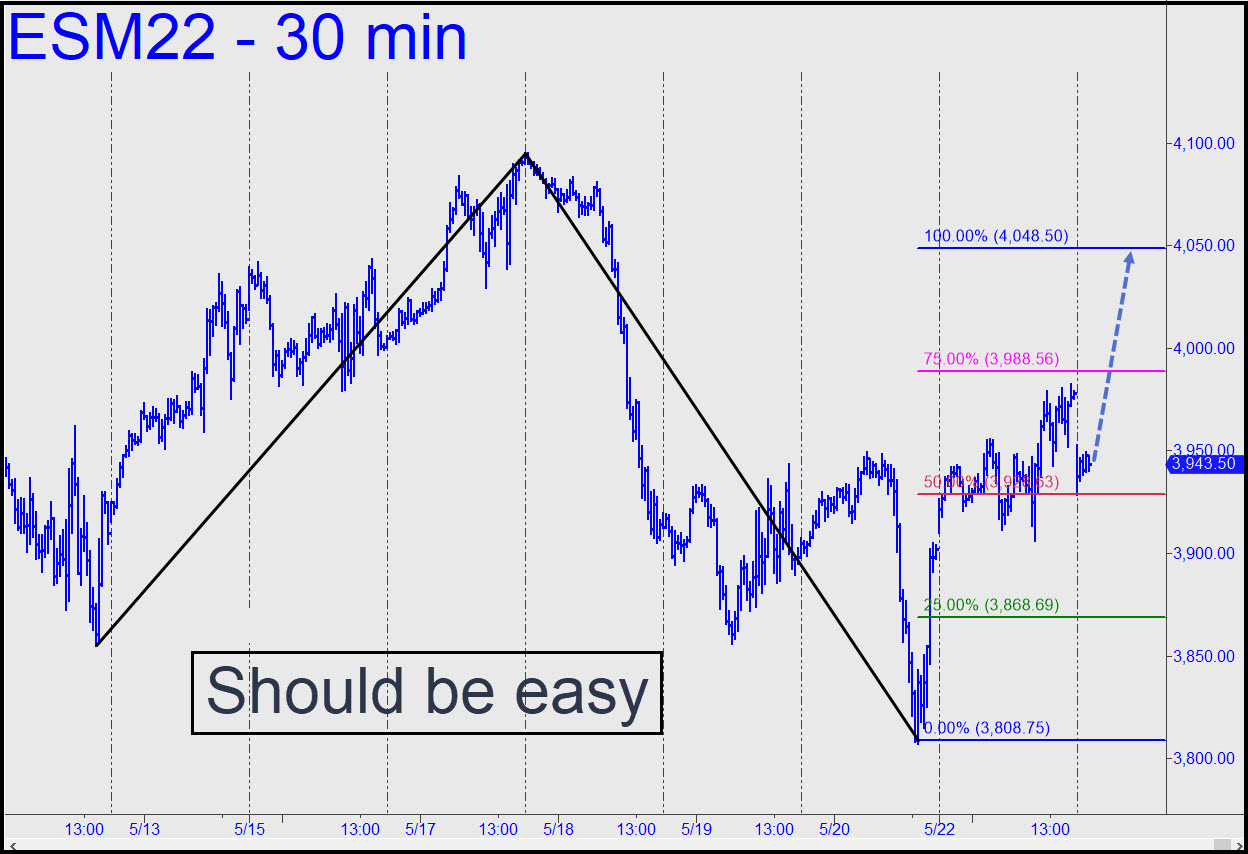
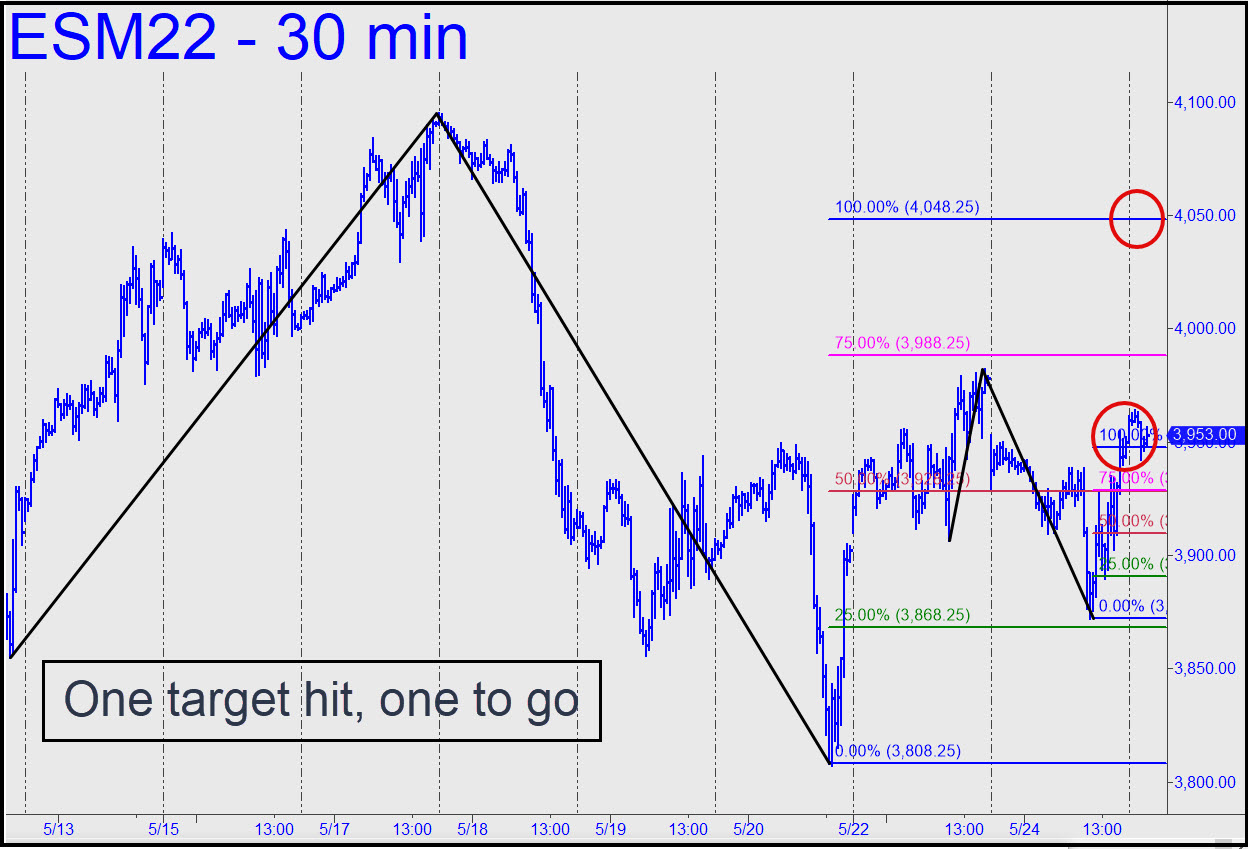
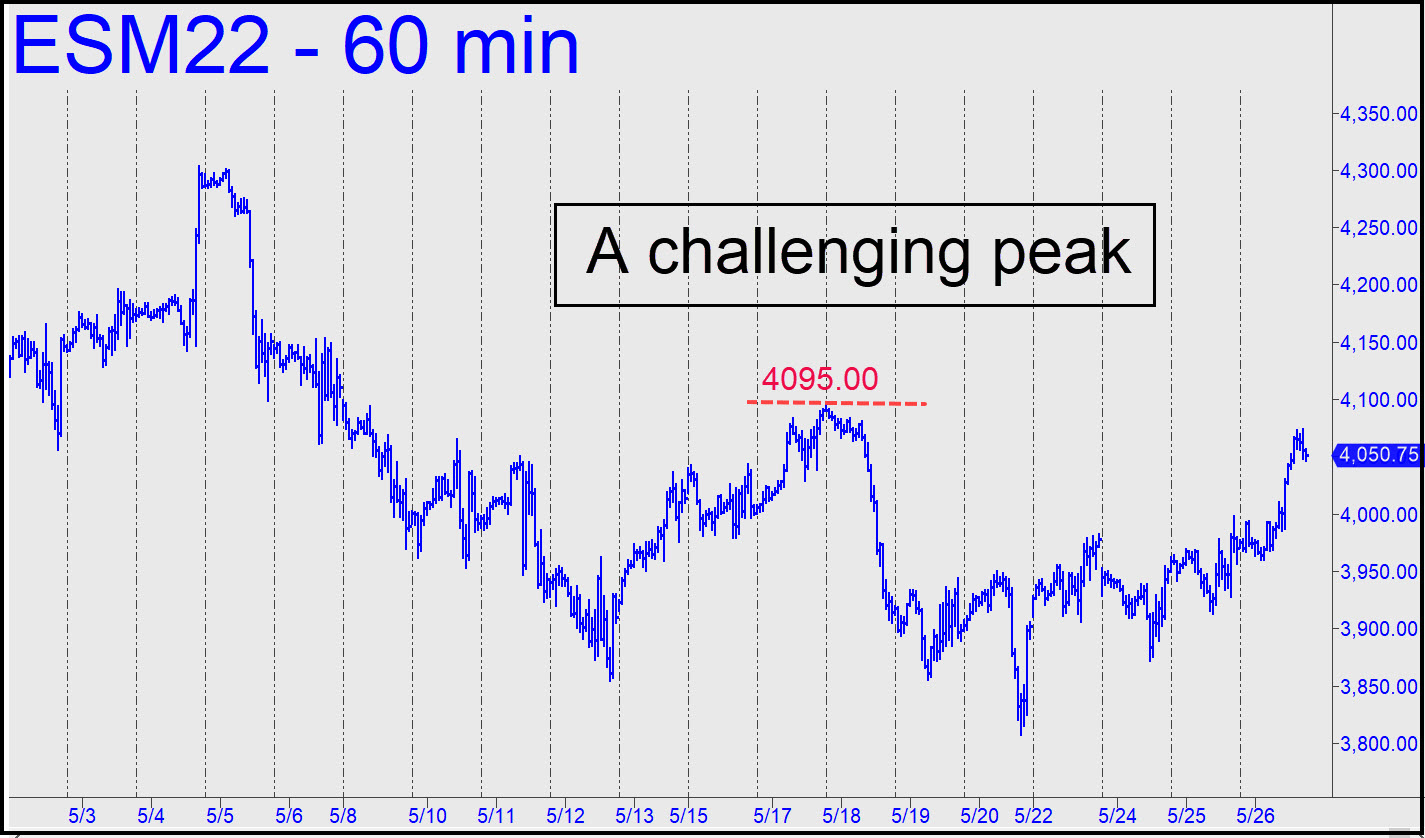
 There is nothing exceptional about the pattern shown — except that this is not the bearish chart of some $50 stock, but rather a tradeable proxy for vast sums of money. Size should have no bearing on the odds of a further fall to D=3650.25, implying that vast additional sums of money are likely to vanish shortly from the ether of the global financial system. The week ended following a stab well beneath a major downside target at 3850.00. Although a vicious short squeeze to 3902.00 reversed the loss, the technical damage is irreparable and implies a continuation of the downtrend. The steepness of the squeeze has made Sunday’s opening unpredictable, even if we ‘know’ this rally will be a short sale at some point. Also, p2=3761.44 promises to be an opportune spot for bottom-fishing when it is reached. ______ UPDATE (May 23, 8:15 p.m. EDT): Use this reverse pattern, with a 4048.50 target, to exploit this vehicle. An overnight pullback to the green line would signal a ‘mechanical’ buy, stop 3808.50, but you could attempt it at p=3928.50 if your ‘mechanical’ chops are up to speed, _______ UPDATE (May 24, 6:54 a.m.): Hard selling overnight has pushed the futures down as much as 60 points, but there was no ‘mechanical’ buy at p because the rally never reached p2 first as required. The bottom-fishing tactic is still valid at x=3868.69, but because it carries theoretical entry risk of $3,000 per contract, I’d suggest the trade only if you’re able to cut that to $300 or less. If I’m in the chat room when the trade ripens, and it will, I’ll provide explicit details for effecting a camouflage entry. ______ UPDATE (May 24, 9:38 p.m.): We missed a nice trade when the futures plummeted 66 points in the early going but failed by a 2.50 points) to reach the green line as I’d stipulated. However, a mechanical buy using a lesser pattern worked thereafter, and we should assume the tactic will continue to work if ES hits the second target posted in the chat room. Buyers easily pushed past the first target, ending the day well above p of the larger pattern. This has shortened the odds of a run-up to 4048.50. Here’s an updated version of the chart I posted in the chat room. ______ UPDATE (May 26, 5:50 p.m.) Buyers easily pushed past the 4048 ‘hidden’ resistance, topping at 4073.50 before selling off slightly. A more daunting resistance at 4095, where the futures made topped on May 17 before falling nearly 300 points. My gut feeling is that the rally will exceed the top, only to die somewhere in the ‘discomfort zone’ that extends for about 60 points above it. We’ll just watch for now.
ESM22 – June E-Mini S&Ps (Last:4050.75)