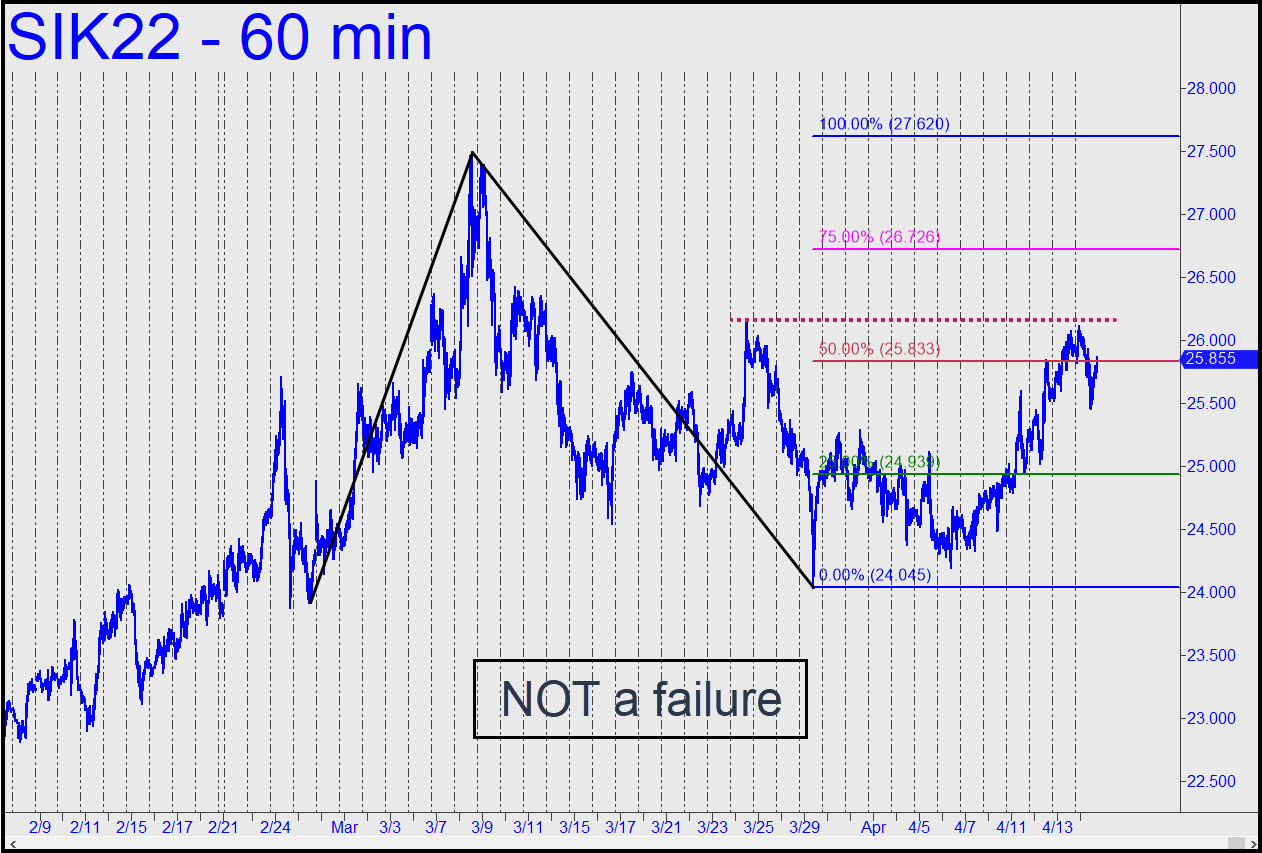
 May Silver’s chart is somewhat more bullish than gold’s because the C-D leg of the pattern shown has decisively penetrated the 25.83 midpoint resistance. That’s notwithstanding the fact that the rally failed to surpass the important ‘external’ peak at 26.16 recorded two months ago. The p midpoint is the more challenging of the two obstacles, and its breach strongly implies buyers will handle the peak easily when the time comes. If that’s what happens, look for the futures to continue their ascent to at least p2=26,73, or even to D=27.62. _______ UPDATE (Apr 20, 1:04 a.m.): A fall to x=24.93 would trip a ‘mechanical’ buy, stop 24.04. That implies entry risk of nearly $4500 per contract, meaning you’ll need to execute the trade camo-style on a chart of 15-minute degree or less to get aboard without betting the ranch. _____ UPDATE (Apr 21, 11:27): The ‘mechanical’ buy suggested above was deeply underwater Thursday night. Several subscribers reported getting aboard, but none mentioned how, so I cannot offer much help with risk control. The trade has a 50% chance of working at this point, but even if it does, it’s not going to be pretty.
SIK22 – May Silver (Last:24.56)