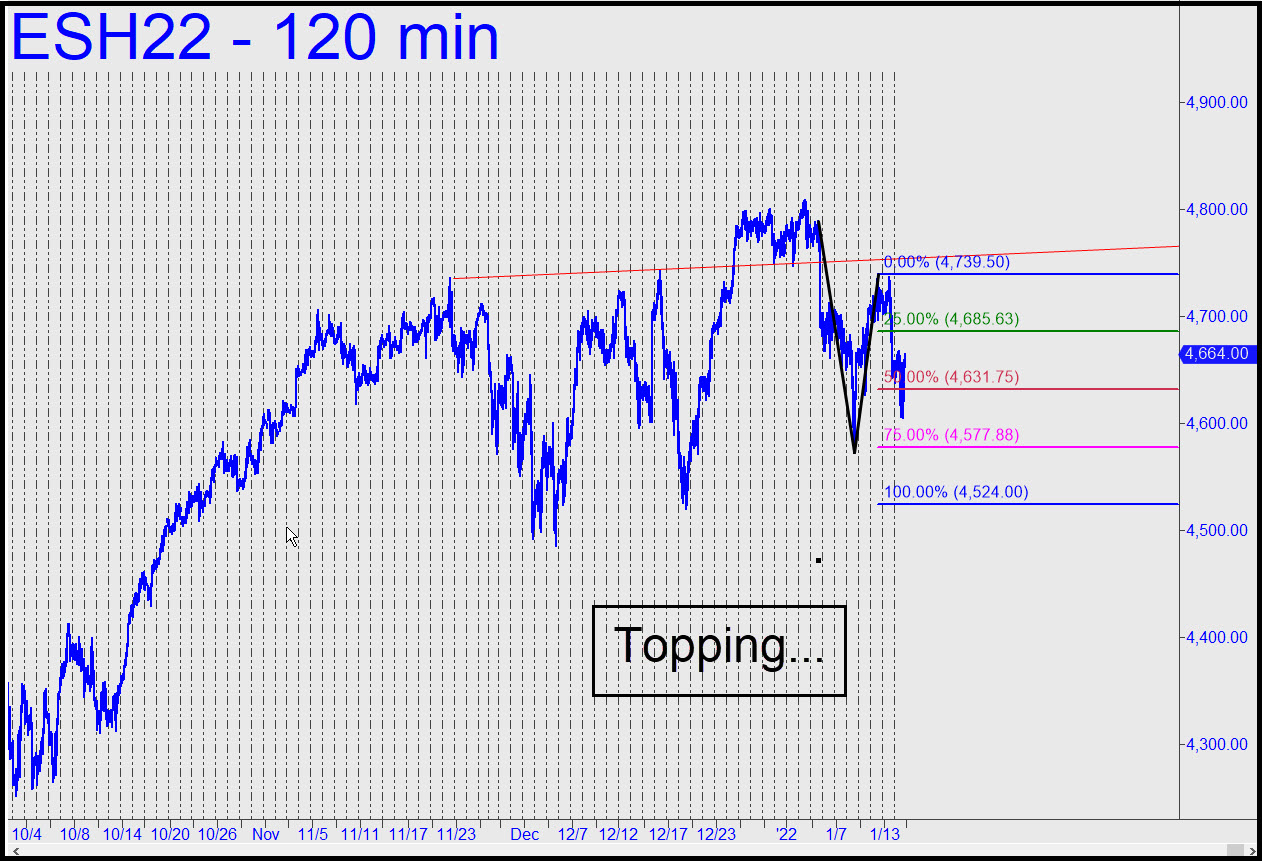
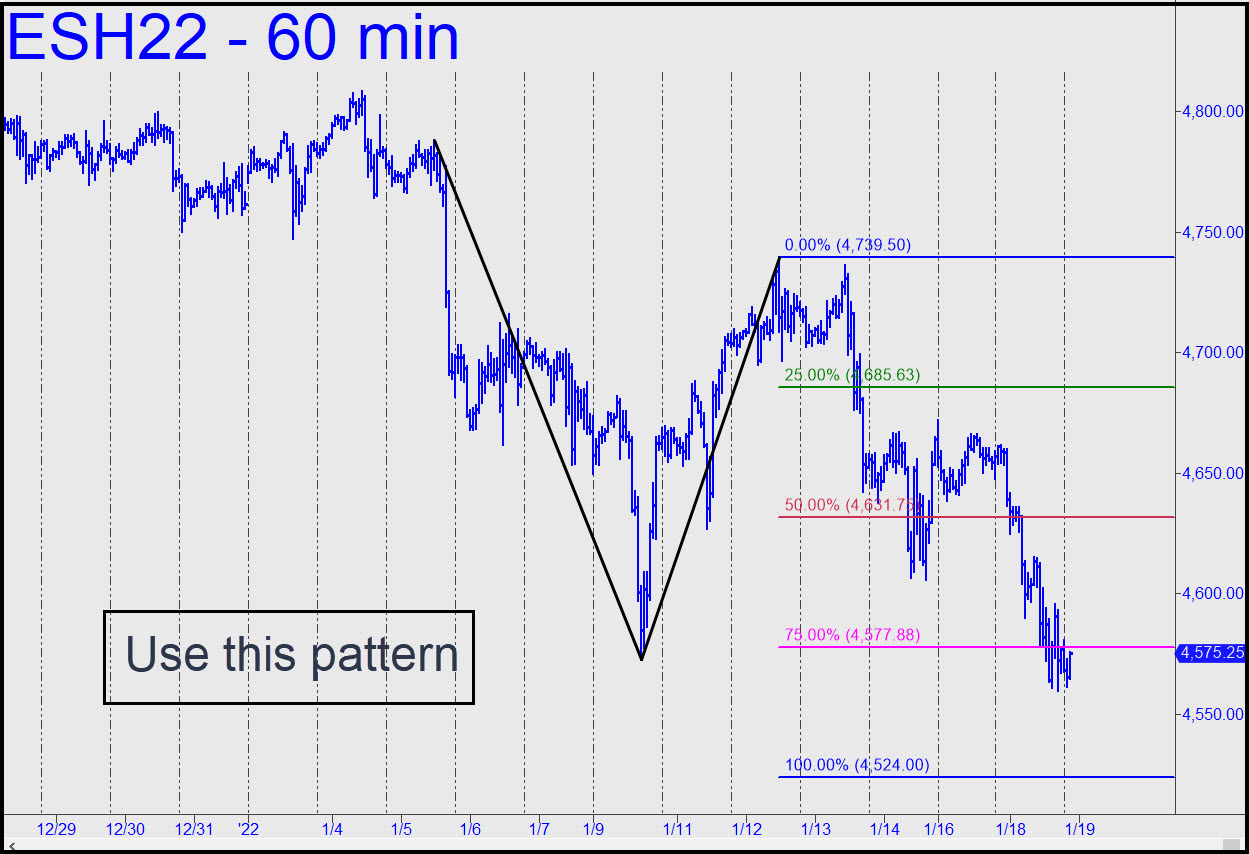
 The S&Ps are in a topping pattern, a middling head-and-shoulders formation with the potential to send the mini-futures down to 4300 once the neckline at 4500 is broken. Presumably, that would be just the first installment of a full-blown bear market. I seldom pay attention to the H&S because it pops up so often on charts of all time frames, but this one is too shapely to ignore. As noted here earlier, it will take several more weeks to develop a symmetrical right shoulder. This implies there are at least one or two more dramatic swoons to play out, possibly tradeably. I’ve added a Hidden Pivot pattern to the chart with two immediate trade possibilities: mechanically shorting a rally to the green line (x=4685.63); or bottom-fishing with a ‘camo’ bid near p2=4577.88. The latter looks somewhat riskier, and that is why I am suggesting that you use a camouflage entry. Nudge me in the chat room if you’re interested. I am somewhat surprised that the last rally did not quite reach the 4752 trendline where we were eager to get short, but there is not enough evidence to suggest we were front-run. Regardless, let’s continue to avoid patterns that are obvious, since every Tom, Dick and Harry is trying to get short at these levels. _______ UPDATE (Jan 18, 10:36 a.m.): The futures have bounced robustly from within two ticks of p2 pivot noted above. This provided an opportunity to get aboard for a quick profit on four contracts of as much as $2,700. Review the chat room discussion beginning with my 9:53 a.m. post to see how the trade unfolded in real time. If you want to learn how to do it yourself, as many subscribers have, you should attend the Wednesday tutorial sessions and immerse yourself in the recordings of them. _______ UPDATE (Jan 18, 8:35): Bulls are struggling for traction, but it looks like D=4524.00 of this pattern will be the first chance they get to turn things around. Bottom-fish there with a tight stop if you’ve made money on the way down or know how to ‘camo’ your way aboard risking just small change. A rally to x=4685.63 would trigger a ‘mechanical’ short, but avoid it unless you know what you’re doing. _______ UPDATE (Jan 19, 10:25 a.m.): The futures reversed in the untradeable middle of the night from a low that fell somewhat shy of the 4524.00 target. This failure could be attributed with no uncertainty to the obviousness of the pattern. It turns out that even the most sophisticated quant shops use the same ABC patterns that we do. We’ll use this episode to recalibrate our sense of gnarly — the only patterns we should be trading. _______ UPDATE (Jan 19, 10:24 p.m.): A relapse has somewhat exceeded D=4524.00, hitting a so-far low at 4514. A more tradeable one seems likely to come from about 15 points lower in the ‘discomfort zone’, but I’ll make this one a DIY-er, for experts only. ______ UPDATE (Jan 20, 7:36 p.m.): Check my posts in the chat room this evening for a detailed technical discussion of what happened today, plus a prediction of what might happen next. _______ UPDATE (Jan 21, 10:23 a.m.): The futures are breaking down below p2=4427, putting the 4372.50 target noted in the chat room in play
ESH22 – March E-Mini S&P (Last:4414.50)