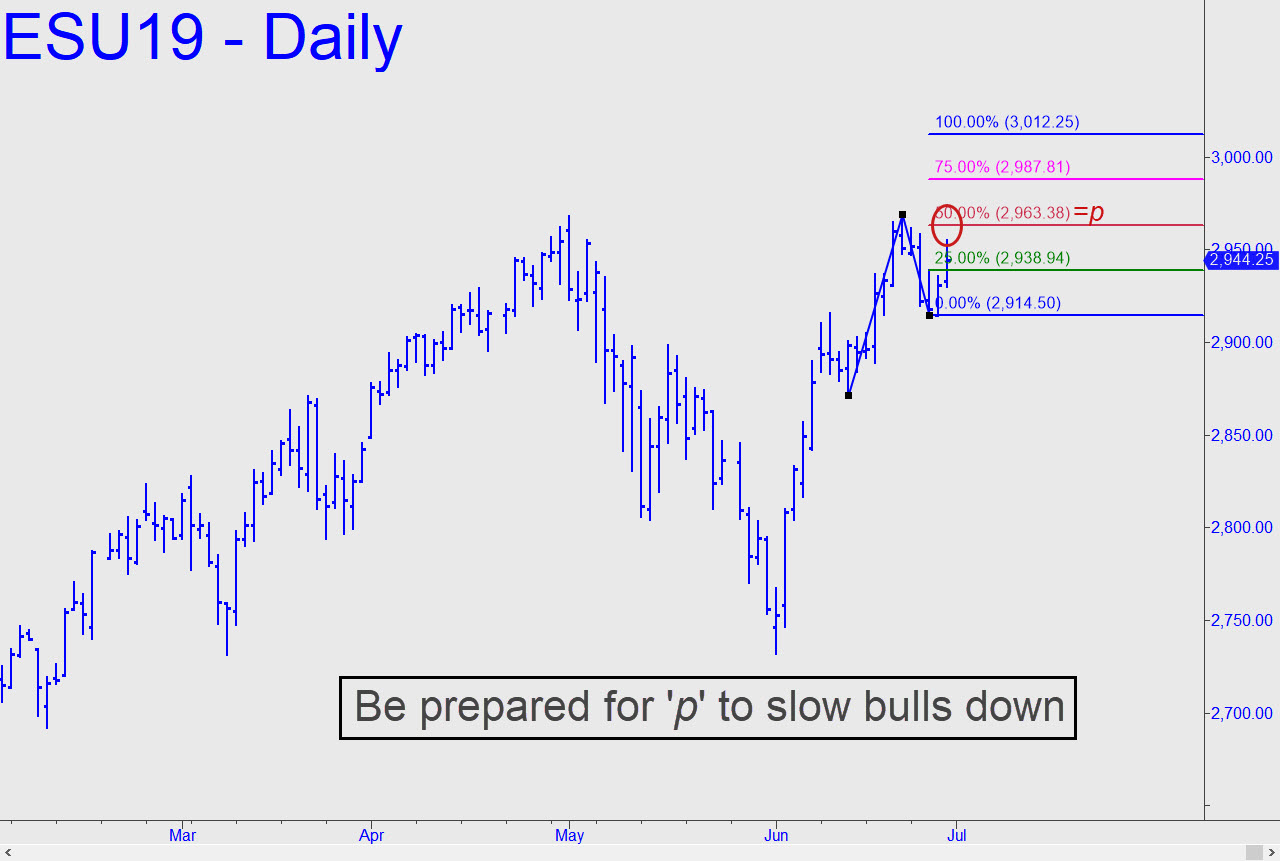
 We can use the bullish pattern shown, with a 2963.38 midpoint resistance and a 3012.25 target, to keep ourselves from getting swept out to sea if buyers decide one of these days to stop paddling. The lower number can serve as a minimum upside objective for the near term, but be aware that it could show enough stopping power to turn back the tide, at least for a spell. If the futures should push past it with ease, however, that would put the higher number in play. Keep in mind that the 3114.50 target of a much larger pattern aired here earlier is still our big-picture target for the longer term. If it is reached, the Dow would be trading at record highs above 28,000. These numbers seem preposterous to me with weakness developing in the global economy and yields falling, but in the end I will always put my personal bias aside and let the charts speaks for themselves. _______ UPDATE (Jul 1, 6:42 p.m. ET): Expect short-covering to drive this bottle rocket most immediately to the 2994.75 target shown here. This looks all but certain, given the way the futures gapped through the midpoint resistance at 2954.63 today. The much-bigger-picture targets at 3012.25 and 3114.50 given above also remain viable.
ESU19 – Sep E-Mini S&P (Last:2963.50)
