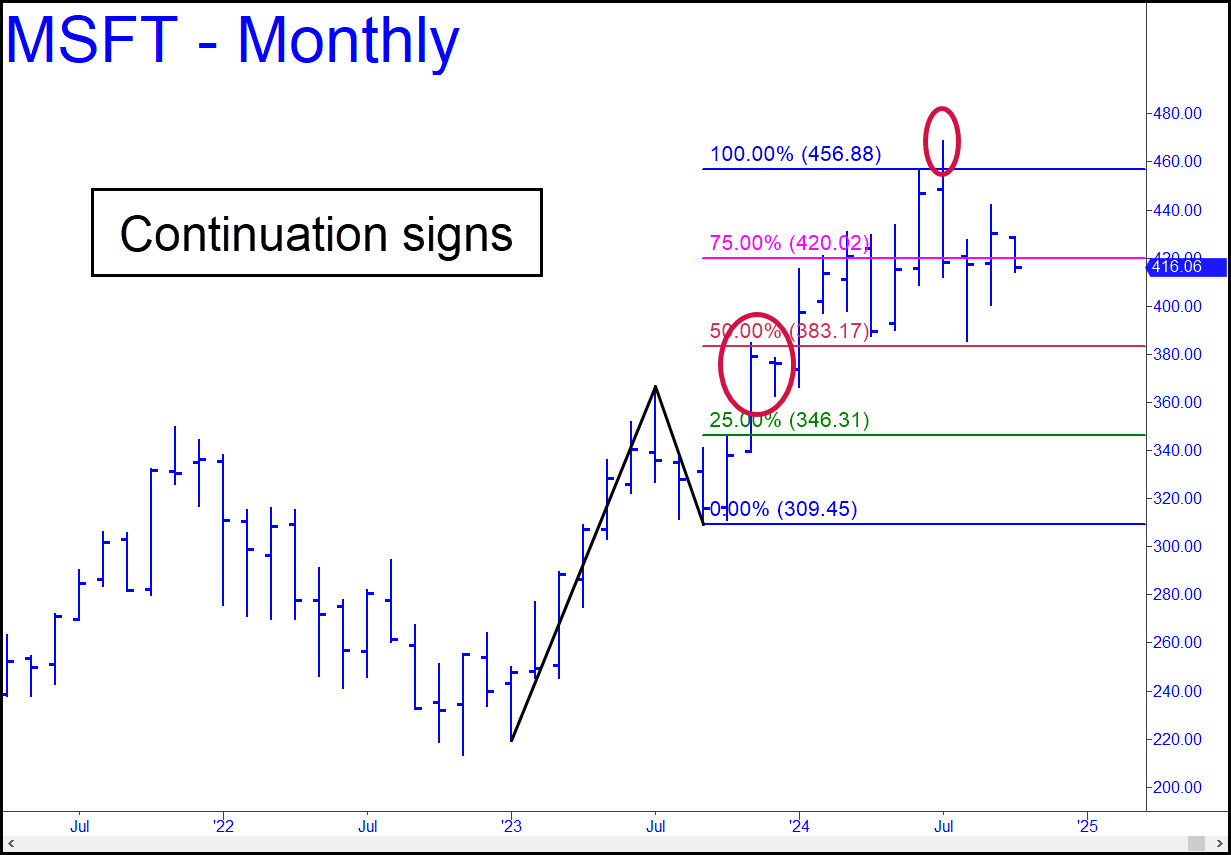
 I have higher targets outstanding, but this picture is more interesting, since it suggests that however much MSFT corrects, it will eventually take out the record 468.35 target recorded in July. The pullback precisely from p=383.17 affirmed the pattern’s reliability, and the shallow pullback that followed, which did not allow a ‘mechanical’ buy, attested to the uptrend’s power. The subsequent poke past D=456.88 provided yet more evidence that new highs are coming. The overshoot may look relatively small, but a pattern this well-formed should have shown the same, precise stopping power as the red line (p). One last thing to notice is that, although MSFT’s correction off the top was steep and wrenching, it did not quite touch the red line. Thus did the steep rally deny us a second ‘mechanical’ buying opportunity. This is an unmistakable sign of strength to come, and it will temper my big-picture permabearishness. Most immediately, look for this retracement to come down to p=400.47. It can be found on the weekly chart, where A=468.35 on 7/5.
MSFT – Microsoft (Last:416.06)
